AgEval: A Benchmark for Zero-Shot and Few-Shot Plant Stress Phenotyping with Multimodal LLMs
Abstract
Plant stress phenotyping traditionally relies on expert assessments and specialized models, limiting scalability in agriculture. Recent advances in multimodal large language models (LLMs) offer potential solutions to this challenge. We present AgEval, a benchmark comprising 12 diverse plant stress phenotyping tasks, to evaluate these models’ capabilities. Our study assesses zero-shot and few-shot in-context learning performance of state-of-the-art models, including Claude, GPT, Gemini, and LLaVA. Results show significant performance improvements with few-shot learning, with F1 scores increasing from 46.24% to 73.37% in 8-shot identification for the best-performing model. Few-shot examples from other classes in the dataset have negligible or negative impacts, although having the exact category example helps to increase performance by 15.38%. We also quantify the consistency of model performance across different classes within each task, finding that the coefficient of variance (CV) ranges from 26.02% to 58.03% across models, implying that subject matter expertise is needed – of ’difficult’ classes – to achieve reliability in performance. AgEval establishes baseline metrics for multimodal LLMs in agricultural applications, offering insights into their promise for enhancing plant stress phenotyping at scale. Benchmark and code can be accessed at:
https://anonymous.4open.science/r/AgEval/
1 Introduction
Food security stands as a paramount global challenge, necessitating sustainable enhancements in agricultural productivity to sustain a growing world population [1]. Agricultural research has increasingly turned to advanced technologies, particularly computer vision and artificial intelligence (AI), to optimize crop management to improve yield, profitability, and sustainability [2]. Phenotyping is the practice of visually inspecting plants and plant products to extract agronomically relevant features that help make downstream decisions. Traditional phenotyping methods—especially for plant stress phenotyping—involve expert visual inspections, are time-consuming, labor-intensive, often subjective, and fail to scale up. Computer vision can play a major role in plant stress phenotyping [3, 4].
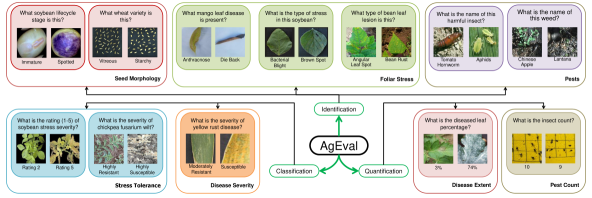
Most problems in the field of plant stress phenotyping can be divided into three primary categories: identification, classification, and quantification of plant stresses. In this study, we adopt an expansive view of plant stress phenotyping that includes traditional stresses, pest infestations, and seed quality issues, reflecting the interconnected nature of plant health factors in agricultural systems. Identification involves detecting the presence of stress—such as drought/heat stress, nutrient deficiency, pathogen infection, or pest/insect/weed infestation—in plants. Classification categorizes the stress into classes defined by subject matter experts, while quantification measures the severity or extent of the stress, including impacts on seed quality. Each task presents unique challenges and necessitates sophisticated analytical methods [5].
Recent advances in computer vision and machine learning have created new opportunities for automating and enhancing plant stress phenotyping [6]. However, the development and deployment of AI-assisted phenotyping systems face several challenges. The effectiveness of these systems relies heavily on the quality and quantity of annotated data. Annotating plant stress data requires expert knowledge in plant pathology, entomology, agronomy, and other disciplines, making the process both costly and time-consuming. This creates a significant bottleneck in the development of AI models for agricultural applications.
Researchers have explored various techniques to develop models that perform well with limited annotated data in plant stress phenotyping tasks [7]. These techniques include transfer learning from large-scale datasets such as ImageNet [8], self-supervised learning using contrastive methods on unlabeled plant images [7], and leveraging vision foundation models for improved generalization [9]. Despite these advancements, challenges persist due to the domain shift between general image datasets and agricultural imagery and the need for specialized visual understanding in plant stress phenotyping. The fine-grained nature of agricultural tasks often requires more nuanced feature recognition than what general pretrained models typically offer, underscoring the necessity for more adaptive and domain-specific approaches.
Recent advances in multimodal large language models (LLMs) have shown promising results in image-text understanding tasks [10, 11]. These models demonstrate remarkable capabilities in processing and understanding visual and textual information jointly [12, 13, 14]. Additionally, these LLMs can perform few-shot in-context learning, adapting to new tasks with just a few examples in the prompt [15]. Their ability to leverage both visual and textual information could potentially bridge the gap between general visual understanding and domain-specific agricultural knowledge.
Our study aims to explore the potential of large multimodal vision-language models for plant stress phenotyping tasks. We hypothesize that their broad understanding of visual and textual information could be particularly beneficial in scenarios where annotated plant stress data is limited. By leveraging their pretrained knowledge of diverse datasets and their ability to understand natural language instructions, these models might offer a more flexible and adaptable solution for plant stress phenotyping and other agricultural AI tasks. In this work, we present a comprehensive evaluation of state-of-the-art multimodal LLMs on plant stress phenotyping tasks, focusing on the identification, classification, and quantification of plant stresses. We curate a benchmark dataset from open sources, reflecting real-world scenarios in agriculture. Our study aims to assess both zero-shot and few-shot in-context learning performance of these models on specialized agricultural tasks.
This study makes several key contributions to plant stress phenotyping using multimodal Large Language Models (LLMs). First, it evaluates these models on plant stress phenotyping tasks, providing valuable insights into their potential to overcome the limitations of traditional approaches. Second, it introduces a curated benchmark dataset that closely mirrors real-world agricultural scenarios, offering a valuable resource for future research on adapting pretrained models to agricultural tasks. Third, the study analyzes the performance of few-shot in-context learning on specialized agricultural tasks, addressing the challenge of limited annotated data and assessing how effectively multimodal LLMs can leverage their pretrained knowledge. Fourth, it presents a comparative analysis of various state-of-the-art multimodal LLMs in the context of plant stress phenotyping. Finally, the study provides a quantitative assessment of how example relevance impacts few-shot in-context learning, further advancing our understanding of these models in agricultural applications.
2 Methodology
This section details our approach to evaluating multimodal LLMs for plant stress phenotyping tasks.
2.1 Task Formulation
We adopt the following taxonomy for plant stress phenotyping tasks, focusing on:
Identification (I): Determining the specific type of stress from predefined options (e.g., identifying bacterial blight in wheat, or identifying a specific weed).
Classification (C): Categorizing stress into distinct severity classes (e.g., classifying iron deficiency chlorosis in soybean leaves into low, medium, or high levels).
Quantification (Q): Measuring the extent or severity of stress numerically (e.g., percentage of leaf area affected by disease).
2.2 AgEval Benchmark Dataset Curation
We curated a diverse dataset comprising 12 subsets, each targeting specific plant stress phenotyping tasks. This collection, compiled from open-source resources, covers three main categories: Identification, Classification, and Quantification. These categories encompass various aspects of plant stress, from seed quality to pest infestations, reflecting the diverse challenges in agricultural stress assessment. The details of these datasets are provided in Table S1. We sampled 100 images from each dataset, evenly distributed across classes. The number of samples per class and the structure and relative sizes of the dataset components are illustrated in Figure S1.
Identification: We considered datasets addressing the identification of seed morphology variations due to stresses, foliar diseases, and pests including weeds and insects that cause stresses. The Durum Wheat Dataset [16] and Soybean Seeds dataset [17] support seed morphology tasks, which involve identifying stress-induced changes in seed characteristics. The Mango Leaf Disease Dataset [18, 19], Bean Leaf Lesions Classification dataset [20], and Soybean Diseases dataset [21] enable foliar stress tasks, focusing on identifying diverse plant stresses affecting leaves, including diseases and adverse environmental conditions. The DeepWeeds dataset [22] and Dangerous Farm Insects dataset [23] facilitate pest identification tasks, which involve recognizing weeds and insects that cause plant stress. These datasets and their associated tasks collectively contribute to assessing stress impacts on seed quality, disease management, and pest control strategies in agriculture.
Classification: We considered datasets for classification of disease severity and stress tolerance into expert-defined classes. The YELLOW-RUST-19 dataset [24, 25, 26] and Fusarium Wilt Disease in Chickpea dataset [27, 28, 29] support disease severity tasks, classifying disease stages caused by pathogens based on color and shape changes. The Iron Deficiency Chlorosis (IDC) Soybean Dataset [30] enables stress tolerance tasks, classifying abiotic stress stages caused by factors like nutrient deficiency or drought.
Quantification: We considered datasets addressing quantification of pest populations and disease extent. The InsectCount dataset [31] supports pest quantification tasks involving counting insects in field images to assess infestation levels and inform pest management decisions. The PlantDoc dataset [32, 33] enables disease quantification tasks, measuring plant stress by segmenting diseased areas in leaf images and quantifying the percentage of affected areas to assess severity and spread.
2.3 Model Selection and Evaluation
We evaluated six multimodal LLMs: three state-of-the-art models (GPT-4V [34], Claude 3.5 Sonnet [35], and Gemini 1.5 Pro [36]), two budget-friendly options (Claude 3 Haiku [37] and Gemini 1.5 Flash [36]), and one open-source alternative (LLaVA v1.6 34B [38]). This selection encompasses a range of commercially available and open-source options to provide a comprehensive evaluation.
We evaluate LLM performance using both zero-shot and few-shot approaches. Zero-shot testing reveals inherent model biases, while few-shot testing (with 1, 2, 4, and 8 examples) indicates how model specialization might change with learning. For few-shot evaluations, we randomly select examples from the dataset. It’s important to note that our few-shot learning refers to in-context learning capability with a few examples, not fine-tuning in a few-shot manner [39].
2.4 Performance Metrics
We evaluated model performance using task-specific metrics: F1-score for Identification (I) tasks, and Normalized Mean Absolute Error (NMAE) for both Classification (C) and Quantification (Q) tasks. For identification tasks, we used the weighted F1-score to account for potential class imbalance:
| (1) |
where is the number of classes and is the weight of the -th class, proportional to the number of samples in that class. For classification and quantification tasks, we calculated NMAE as:
| (2) |
where is the number of samples, is the true value, is the predicted value, and and are the maximum and minimum labels in the dataset. Note that the labels for classification problem are mapped to their corresponding ordinal values to be able to calculating NMAE. To handle out-of-vocabulary predictions from large language models in classification tasks, we assigned the worst possible score to unseen labels in the ordinal mapping. This approach penalizes predictions that fall outside the expected set of classes, which is important in agricultural applications where misclassification can lead to incorrect treatment decisions.
In addition to these task-specific metrics, we employ Mean Reciprocal Rank (MRR) to compare model performance across datasets. MRR is calculated separately for Identification (ID) and Classification/Quantification (CQ) datasets:
| (3) |
where: ; is the number of models being compared; is the number of datasets in category ; and is the rank of model for the -th dataset in category . Ranks are determined as:
| (4) |
| (5) |
MRR is a comparative metric that indicates relative performance among models. It is calculated separately for zero-shot () and 8-shot () settings:
| (6) |
2.4.1 Relevance of Examples in Few-Shot Learning
This analysis (conducted for identification problems) quantifies the impact of example relevance in few-shot learning for the AgEval benchmark. We examine the effectiveness of examples from the same category versus diverse examples in predicting image labels. This analysis aims to determine whether examples from the same dataset (or in a real-world scenario, examples related to the farmer’s actual input) have a positive or negative impact on predictions. The findings aim to inform strategies for both end-users with limited examples and practitioners considering optimal few-shot prompts for multimodal language models. For this we utilized previous experiment runs where few shot examples and their labels were logged for each input across different shot settings.
Let be the dataset, where is an input and its true label. For a k-shot setting, let be the set of examples provided in the prompt for input , where is an example and its label, such that for all .
Definition 1 (Bullseye Shot)
A k-shot prompt for input is considered a bullseye shot if:
| (7) |
For each dataset and shot number , we partition into bullseye () and non-bullseye () subsets:
| (8) |
| (9) |
We evaluate the impact using the performance delta from 0-shot ():
| (10) |
| (11) |
where is the 0-shot F1-score and is the F1-score on the respective subset. The average impact across all evaluated shot numbers is calculated as:
| (12) |
| (13) |
where is the set of all shot numbers evaluated. This analysis quantifies the performance impact of having relevant examples in few-shot prompts.
| Model | Seed Morphology | Foliar Stress | Pests | ||||
|---|---|---|---|---|---|---|---|
| Durum Wheat | Soybean | Mango Leaf Disease | Bean Leaf Lesions | Soybean Diseases | Dangerous Insects | Weeds | |
| Gemini-pro-1.5 | 55.56 | 26.24 | 42.91 | 77.22 | 21.78 | 82.67 | 46.83 |
| GPT-4o | 55.1 | 19.0 | 58.41 | 65.92 | 3.7 | 82.79 | 38.77 |
| Claude-3.5-sonnet | 55.56 | 38.7 | 49.82 | 68.65 | 8.54 | 82.02 | 18.85 |
| Gemini-flash-1.5 | 53.64 | 24.58 | 42.85 | 70.61 | 14.41 | 80.38 | 32.83 |
| Claude-3-haiku | 36.06 | 31.24 | 29.83 | 55.26 | 12.69 | 51.28 | 13.86 |
| LLaVA v1.6 34B | 40.56 | 13.74 | 13.63 | 44.03 | 8.54 | 18.54 | 8.68 |
| Model | Disease Severity | Stress Tolerance | Pest | Disease | |
|---|---|---|---|---|---|
| Yellow Rust 19 | FUSARIUM 22 | IDC | InsectCount | PlantDoc | |
| Claude-3.5-sonnet | 22.29 | 18.25 | 26.28 | 16.25 | 15.59 |
| GPT-4o | 17.19 | 37.0 | 18.88 | 15.8 | 18.14 |
| Gemini-flash-1.5 | 31.25 | 24.0 | 19.39 | 16.32 | 21.22 |
| Gemini-pro-1.5 | 26.25 | 33.0 | 30.87 | 29.0 | 9.57 |
| Claude-3-haiku | 37.08 | 25.75 | 22.86 | 28.34 | 22.14 |
| LLaVA v1.6 34B | 35.94 | 30.6 | 25.51 | 26.19 | 41.72 |
2.4.2 Intra-task Uniformity
To evaluate the performance of LLM across different classes within individual (identification) tasks, we employ the Coefficient of Variation (CV) of all classes’ F1 scores. For example, a model could give high overall F1 score in identifying mangoe leaf disease but could be completely failing in identifying one of the class ’Cutting Weevil’. This analysis quantifies edge cases like that. For each model-dataset combination, we calculate the CV as follows:
| (14) |
where is the standard deviation of F1 scores across classes, and is the mean F1 score. The CV provides a normalized measure of dispersion, allowing for comparison across datasets with different scales. For each identification dataset and model , we calculate:
| (15) |
where is the number of classes in dataset , is the F1 score for class , and is the mean F1 score across all classes for dataset and model . We then compute average CVs across datasets and models:
| (16) |
| (17) |
where is the set of all models and is the set of all datasets. These metrics allow us to quantify and compare the consistency of model performance across classes, identifying potential biases or challenges in specific classes or model behaviors.
2.5 Prompt Engineering
We designed task-specific prompts to guide the multimodal LLMs in performing the ICQ tasks. The prompts were structured to provide clear instructions and ensure consistent output formatting across all models.
Given the image, identify the class. Use the following list of possible classes for your prediction It should be one of the : {expected_classes}. Be attentive to subtle details as some classes may appear similar. Provide your answer in the following JSON format:{"prediction": "class_name"}Replace "class_name" with the appropriate class from the list above based on your analysis of the image. The labels should be entered exactly as they are in the list above i.e., {expected_classes}. The response should start with { and contain only a JSON object (as specified above) and no other text.
For identification and classification tasks, we used a universal prompt template shown above (unless otherwise stated). Specialized prompts used for quantification tasks are given in the Supplement. For few-shot scenarios, we prepend examples to these prompts, maintaining the same structure and format across all shot counts to ensured consistency in inputs given to multiple model.
| Model | Seed Morphology | Foliar Stress | Pests | ||||
|---|---|---|---|---|---|---|---|
| Durum Wheat | Soybean | Mango Leaf Disease | Bean Leaf Lesions | Soybean Diseases | Dangerous Insects | Weeds | |
| GPT-4o | 95.94 | 48.29 | 80.96 | 86.9 | 62.96 | 82.56 | 56.03 |
| Gemini-pro-1.5 | 79.66 | 52.19 | 71.68 | 78.17 | 24.41 | 82.98 | 49.96 |
| Claude-3.5-sonnet | 89.66 | 51.17 | 61.68 | 84.78 | 11.07 | 81.89 | 27.17 |
| Gemini-flash-1.5 | 83.7 | 48.09 | 64.66 | 73.42 | 23.67 | 82.72 | 41.89 |
| Claude-3-haiku | 53.29 | 38.02 | 38.92 | 46.42 | 8.81 | 45.08 | 15.34 |
| LLaVA v1.6 34B | 46.8 | 23.1 | 22.84 | 48.5 | 10.53 | 12.08 | 13.23 |
| Model | Disease Severity | Stress Tolerance | Pest | Disease | |
|---|---|---|---|---|---|
| Yellow Rust 19 | FUSARIUM 22 | IDC | InsectCount | PlantDoc | |
| Claude-3.5-sonnet | 16.04 | 14.0 | 16.84 | 5.75 | 11.31 |
| Gemini-pro-1.5 | 17.08 | 17.0 | 12.04 | 9.57 | 13.04 |
| Gemini-flash-1.5 | 20.83 | 17.5 | 15.56 | 6.11 | 12.92 |
| GPT-4o | 15.83 | 19.75 | 60.82 | 6.84 | 10.93 |
| Claude-3-haiku | 25.69 | 21.75 | 23.06 | 19.16 | 17.57 |
| LLaVA v1.6 34B | 30.56 | 60.0 | 60.82 | 13.18 | 26.28 |
Highest Lowest across 1, 2, 4, and 8-shot settings for both Bullseye and Non-Bullseye. Average Impact values are in bold.
| Baseline | Bullseye Shots | Non-Bullseye Shots | |||||||||
|---|---|---|---|---|---|---|---|---|---|---|---|
| 0-shot | 1-shot | 2-shot | 4-shot | 8-shot | Avg. Impact | 1-shot | 2-shot | 4-shot | 8-shot | Avg. Impact | |
| Durum Wheat | 51.18 | +31.10 | +23.74 | +28.02 | +30.67 | +28.38 | -01.74 | +01.03 | -04.39 | -11.85 | -04.24 |
| Soybean Seeds | 27.95 | +27.10 | +15.54 | +13.79 | +21.77 | +19.55 | -01.48 | +05.57 | +05.44 | +09.20 | +04.68 |
| Mango Leaf Disease | 44.76 | +22.61 | +22.90 | +17.34 | +28.30 | +22.79 | -02.02 | -02.96 | -00.40 | +03.31 | -00.52 |
| Bean Leaf Lesions | 67.53 | +11.46 | +05.01 | +07.67 | +06.90 | +07.76 | -06.08 | -05.61 | -09.65 | -07.87 | -07.30 |
| Soybean Diseases | 12.23 | +49.05 | +17.71 | +09.26 | +06.54 | +20.64 | +00.26 | +06.98 | +04.95 | +11.73 | +05.98 |
| Dangerous Insects | 75.83 | -12.05 | -10.92 | -12.67 | -04.15 | -09.95 | -00.92 | +02.04 | +03.37 | +01.90 | +01.60 |
| DeepWeeds | 30.23 | +22.37 | +24.79 | +13.85 | +12.86 | +18.47 | -02.03 | -03.32 | -00.35 | +01.55 | -01.04 |
| Average | 44.24 | +21.66 | +14.11 | +11.04 | +14.70 | +15.38 | -02.00 | +00.53 | -00.15 | +01.14 | -00.12 |
3 Results
3.1 Zero-shot Performance
The zero-shot performance of various models on the AgEval benchmark reveals interesting patterns in their capabilities without task-specific training (Figure 2). In identification tasks, Gemini-pro-1.5 demonstrates the strongest performance with an MRR of 0.69, significantly outperforming other models. This suggests that Gemini-pro-1.5’s pretraining allows it to generalize well to AgEval’s identification tasks without additional context.
For classification and quantification tasks, GPT-4o emerges as the top performer with an MRR of 0.70, closely followed by Claude-3.5-sonnet at 0.54. This indicates that these models have a robust ability to understand and analyze images for more complex AgEval tasks like disease severity assessment and stress tolerance evaluation, even without specific examples. Interestingly, while Gemini-pro-1.5 excels in identification, it shows a notable drop in performance for classification and quantification tasks (MRR of 0.37). This disparity highlights the varying strengths of different models across task types in the AgEval benchmark, emphasizing the importance of model selection based on specific requirements within the agricultural domain.
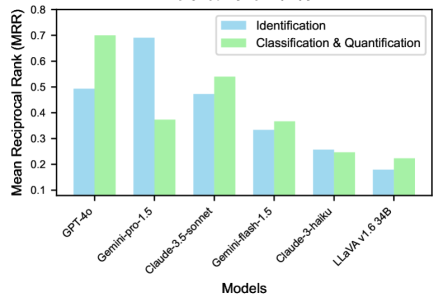
Identification Tasks (F1 Score): In zero-shot identification tasks, Gemini-pro-1.5 leads with an average F1 score of 50.45 across the 7 tasks, outperforming others in 4 out of 7 tasks. It excels in Dangerous Insects (82.67) and Bean Leaf Lesions (77.22) identification. GPT-4o follows with 46.24 F1, showing strength in Mango Leaf Disease identification (58.41). Claude-3.5-sonnet performs competitively (46.02), particularly in Soybean Seeds identification (38.70). Notably, performance on the Soybean Diseases task is generally low across models, likely due to low image resolution.
Classification and Quantification Tasks (NMAE): For zero-shot classification and quantification, Claude-3.5-sonnet leads with the lowest average NMAE of 19.73 across 5 tasks, excelling in FUSARIUM 22 classification (18.25). GPT-4o follows closely (21.40), outperforming in 3 out of 5 tasks, including Yellow Rust 19 classification (17.19) and InsectCount quantification (15.80).
3.2 Full (8)-shot Performance
The introduction of eight examples per task (8-shot learning) leads to significant changes in model performance (Figure 3). For identification tasks, GPT-4o demonstrates remarkable improvement, achieving the highest MRR of 0.81, a substantial increase from its zero-shot performance. This suggests that GPT-4o effectively leverages additional context to enhance its understanding of the identification tasks. In classification and quantification tasks, Claude-3.5-sonnet is the top performer with an MRR of 0.66. GPT-4o maintains strong performance in this category as well, with an MRR of 0.55. The consistent high performance of GPT-4o across both task types indicates its versatility in addressing various aspects of this benchmark.
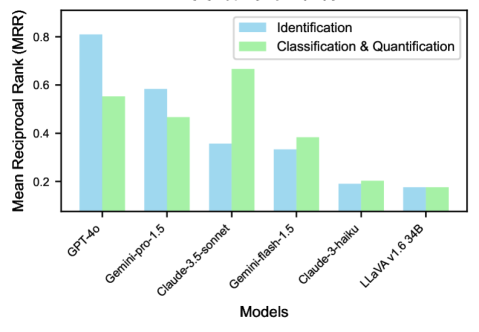
Notably, most models show improved performance with 8-shot learning compared to zero-shot, particularly in more complex classification and quantification tasks. This underscores the value of providing even a small number of examples in enhancing model accuracy. However, the degree of improvement varies across models, highlighting differences in their ability to utilize additional context effectively when tackling the diverse challenges presented.
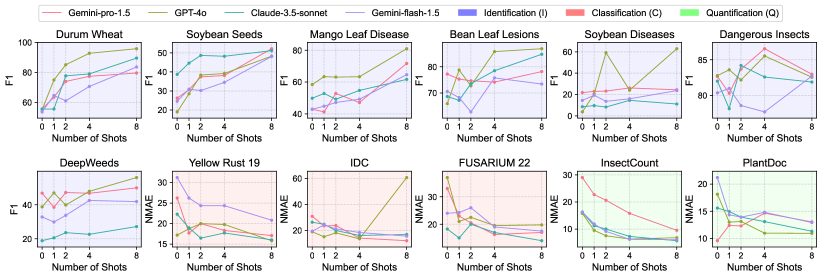
Identification Tasks (F1 Score): In 8-shot identification, GPT-4o significantly improves, achieving an average F1 score of 73.37 and outperforming in 5 out of 7 tasks. It excels in Durum Wheat (95.94) and Bean Leaf Lesions (86.90) identification. Gemini-pro-1.5 maintains strong performance (62.72), leading in DeepWeeds identification (49.96). Interestingly, the Dangerous Insects task shows a slight performance decrease for some models, possibly due to the already high zero-shot performance.
Classification and Quantification Tasks (NMAE): For 8-shot classification and quantification, Claude-3.5-sonnet maintains the lead with an average NMAE of 12.78, excelling in 3 out of 5 tasks, including Yellow Rust 19 classification (16.04) and InsectCount quantification (5.75). Gemini-pro-1.5 shows substantial improvement (13.74), particularly in IDC classification (12.04). It’s worth noting that LLaVA’s performance unexpectedly deteriorates with increased shot numbers, often resulting in unparsable outputs and incorrect predictions. This anomaly suggests potential limitations in LLaVA’s in-context learning capabilities for the AgEval benchmark tasks. These results underscore the varying impacts of few-shot learning across models and tasks within AgEval, highlighting the importance of model selection based on specific agricultural task requirements and the potential influence of factors like image quality on performance.
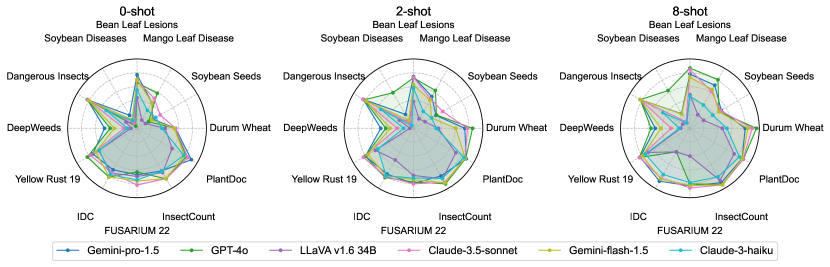
3.3 Relevance of Examples in Few-Shot Learning
The relevance of examples in few-shot learning significantly influences model performance across various identification tasks. As shown in Table 3, the presence of exact category examples (Bullseye) consistently improves F1 scores, with an average increase of 15.38% across all shot settings. This impact is most pronounced in the 1-shot scenario (+21.66%), highlighting the role of relevant examples when context is limited. Conversely, the absence of exact category examples (Non-Bullseye) has a minimal overall impact (-0.12% on average), suggesting that models demonstrate robustness to irrelevant examples, especially as the number of shots increases.
The benefits of relevant examples persist across different shot counts, albeit with diminishing returns. The average Bullseye impact decreases from +21.66% in 1-shot to +14.70% in 8-shot settings, indicating that while relevant examples remain beneficial, their individual importance lessens with increased context. Dataset-specific variations are substantial: Soybean Diseases shows the highest Bullseye impact (+49.05% in 1-shot), while Bean Leaf Lesions exhibits more modest improvements (+11.46% in 1-shot). The Dangerous Insects dataset presents an exception, showing negative impacts even with Bullseye examples (-9.95% average impact), which may indicate domain-specific challenges. These findings underscore the importance of example selection in few-shot learning, particularly in low-shot scenarios, and suggest that the effectiveness of this approach varies across different domains within identification tasks. Please note that Llava was excluded from this analysis due to failure in few-shot learning for our benchmark (see Figure 5).
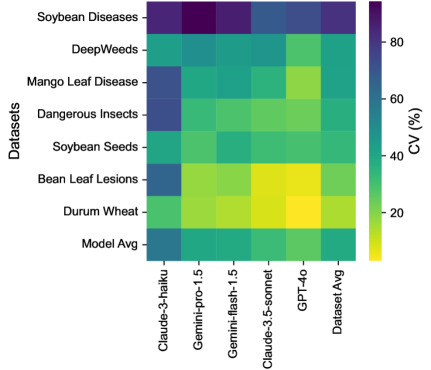
3.4 Intra-task Uniformity
Among LLMs, GPT-4o demonstrated the most consistent performance (Figure 6) with the lowest average CV (26%), while Claude-3-haiku showed the highest variability (CV=58%). Gemini-pro-1.5 and Gemini-flash-1.5 exhibited moderate consistency (CV39%), with Claude-3.5-sonnet performing slightly better (CV=32%).
Regarding datasets, Soybean Diseases exhibited the highest average CV (81.29%), indicating significant variability in model performance across its classes, potentially due to its low image resolution. Conversely, Durum Wheat showed the lowest average CV (14.28%), implying more uniform performance. DeepWeeds and Mango Leaf Disease also demonstrated high variability (CV >40%), highlighting challenges in consistently identifying diverse species and conditions.
These findings underscore the importance of considering not just overall accuracy, but also consistency across classes when selecting models for agricultural identification tasks. The substantial variations observed across datasets and models highlight the need for targeted improvements in LLM training and fine-tuning to enhance performance uniformity. Detailed plots for each dataset’s classes are provided in the supplement, offering deeper insights into class-specific performance variations.
3.5 Key Findings
Here are 4 key findings from our evaluation:
(1) GPT-4o demonstrates superior adaptability across AgEval tasks, showing significant improvement with few-shot learning (F1 score increase from 46.24 to 73.37).
(2) Example relevance significantly impacts few-shot learning: On averge, exact category examples (bullseyes) improve F1 scores by 15.38% , while related examples from different classes have negligible impact.
(3) LLM performance within datasets differs widely: Coefficient of Variation ranges from 26.02% (GPT-4o) to 58.03% (Claude-3-haiku), indicating that even top-performing models may struggle with consistent accuracy across all classes in plant stress phenotyping tasks.
(4) Different models have their own strengths: Gemini-pro-1.5 excels in zero-shot identification (MRR 0.69), while GPT-4o leads in zero-shot classification/quantification (MRR 0.70). And Claude Sonnet-3.5 consistently performs better in classification/quantification tasks
4 Conclusions
This study introduces AgEval, a curated benchmark for evaluating state-of-the-art multimodal LLMs on plant stress phenotyping tasks. We assembled a diverse set of tasks from public and internal sources, focusing on identification, classification, and quantification across various crops and stress types. Our evaluation methodology examines zero-shot and few-shot performance, the impact of example relevance on predictions, and quantifies the variation in model performance across different classes within each task using the Coefficient of Variation. The results demonstrate the potential of multimodal LLMs in addressing plant stress phenotyping challenges, with varying strengths observed across different models and task categories. This work establishes a strong baseline benchmark for future LLMs to test their capabilities in agricultural contexts and lays the groundwork for more diverse benchmarks in this domain.
Future research could expand the scope to cover a broader range of agricultural tasks beyond plant stress phenotyping. Additionally, as our analysis was limited to 8 shots, future work could explore increased shot counts for tasks where performance did not plateau, to get further insights. Models could be fine-tuned to specifically improve performance on non-bullseye examples and enhance intra-task uniformity, potentially increasing consistency across different classes within each task. Finally, it will be important to assess the resource requirements of deploying these models in real-world agricultural settings (computational costs, continuous data updates, integration with existing agricultural systems, carbon footprint, as well as data privacy implications).
References
- Anderson et al. [2004] Pamela K Anderson, Andrew A Cunningham, Nikkita G Patel, Francisco J Morales, Paul R Epstein, and Peter Daszak. Emerging infectious diseases of plants: pathogen pollution, climate change and agrotechnology drivers. Trends in ecology & evolution, 19(10):535–544, 2004.
- Sarkar et al. [2023] Soumik Sarkar, Baskar Ganapathysubramanian, Arti Singh, Fateme Fotouhi, Soumyashree Kar, Koushik Nagasubramanian, Girish Chowdhary, Sajal K Das, George Kantor, Adarsh Krishnamurthy, Nirav Merchant, and Asheesh K. Singh. Cyber-agricultural systems for crop breeding and sustainable production. Trends in Plant Science, 2023.
- Fahlgren et al. [2015] Noah Fahlgren, Malia A Gehan, and Ivan Baxter. Lights, camera, action: high-throughput plant phenotyping is ready for a close-up. Current opinion in plant biology, 24:93–99, 2015.
- Araus and Cairns [2014] José Luis Araus and Jill E Cairns. Field high-throughput phenotyping: the new crop breeding frontier. Trends in plant science, 19(1):52–61, 2014.
- Ubbens and Stavness [2017] Jordan R Ubbens and Ian Stavness. Deep plant phenomics: a deep learning platform for complex plant phenotyping tasks. Frontiers in plant science, 8:1190, 2017.
- Pound et al. [2017] Michael P Pound, Jonathan A Atkinson, Alexandra J Townsend, Michael H Wilson, Marcus Griffiths, Aaron S Jackson, Adrian Bulat, Georgios Tzimiropoulos, Darren M Wells, Erik H Murchie, et al. Deep machine learning provides state-of-the-art performance in image-based plant phenotyping. Gigascience, 6(10):gix083, 2017.
- Ogidi et al. [2023] Franklin C Ogidi, Mark G Eramian, and Ian Stavness. Benchmarking self-supervised contrastive learning methods for image-based plant phenotyping. Plant Phenomics, 5:0037, 2023.
- Mohanty et al. [2016] Sharada P Mohanty, David P Hughes, and Marcel Salathé. Using deep learning for image-based plant disease detection. Frontiers in plant science, 7:1419, 2016.
- Chen et al. [2023] Feng Chen, Mario Valerio Giuffrida, and Sotirios A Tsaftaris. Adapting vision foundation models for plant phenotyping. In Proceedings of the IEEE/CVF International Conference on Computer Vision, pages 604–613, 2023.
- Alayrac et al. [2022] Jean-Baptiste Alayrac, Jeff Donahue, Pauline Luc, Antoine Miech, Iain Barr, Yana Hasson, Karel Lenc, Arthur Mensch, Katherine Millican, Malcolm Reynolds, et al. Flamingo: a visual language model for few-shot learning. Advances in neural information processing systems, 35:23716–23736, 2022.
- Dai et al. [2023] Wenliang Dai, Junnan Li, D Li, AMH Tiong, J Zhao, W Wang, B Li, P Fung, and S Hoi. Instructblip: Towards general-purpose vision-language models with instruction tuning. arxiv 2023. arXiv preprint arXiv:2305.06500, 2, 2023.
- Yu et al. [2023] Weihao Yu, Zhengyuan Yang, Linjie Li, Jianfeng Wang, Kevin Lin, Zicheng Liu, Xinchao Wang, and Lijuan Wang. Mm-vet: Evaluating large multimodal models for integrated capabilities. arXiv preprint arXiv:2308.02490, 2023.
- Bitton et al. [2023] Yonatan Bitton, Hritik Bansal, Jack Hessel, Rulin Shao, Wanrong Zhu, Anas Awadalla, Josh Gardner, Rohan Taori, and Ludwig Schimdt. Visit-bench: A benchmark for vision-language instruction following inspired by real-world use. arXiv preprint arXiv:2308.06595, 2023.
- Wang et al. [2024] Fei Wang, Xingyu Fu, James Y Huang, Zekun Li, Qin Liu, Xiaogeng Liu, Mingyu Derek Ma, Nan Xu, Wenxuan Zhou, Kai Zhang, et al. Muirbench: A comprehensive benchmark for robust multi-image understanding. arXiv preprint arXiv:2406.09411, 2024.
- Jiang et al. [2024] Yixing Jiang, Jeremy Irvin, Ji Hun Wang, Muhammad Ahmed Chaudhry, Jonathan H Chen, and Andrew Y Ng. Many-shot in-context learning in multimodal foundation models. arXiv preprint arXiv:2405.09798, 2024.
- Kaya and Saritas [2019] Esra Kaya and İsmail Saritas. Towards a real-time sorting system: Identification of vitreous durum wheat kernels using ann based on their morphological, colour, wavelet and gaborlet features. Computers and Electronics in Agriculture, 166:105016, 2019.
- Warcoder [Accessed: 2024-07-15] Warcoder. Soyabean seeds dataset. https://www.kaggle.com/datasets/warcoder/soyabean-seeds, Accessed: 2024-07-15.
- Shah [Accessed: 2024-07-15] Arya Shah. Mango leaf disease dataset. https://www.kaggle.com/datasets/aryashah2k/mango-leaf-disease-dataset, Accessed: 2024-07-15.
- Ahmed et al. [2023] Sarder Iftekhar Ahmed, Muhammad Ibrahim, Md Nadim, Md Mizanur Rahman, Maria Mehjabin Shejunti, Taskeed Jabid, and Md Sawkat Ali. Mangoleafbd: A comprehensive image dataset to classify diseased and healthy mango leaves. Data in Brief, 47:108941, 2023.
- Marquis03 [Accessed: 2024-07-15] Marquis03. Bean leaf lesions classification. https://www.kaggle.com/datasets/marquis03/bean-leaf-lesions-classification, Accessed: 2024-07-15.
- Ghosal et al. [2018] Sambuddha Ghosal, David Blystone, Asheesh K Singh, Baskar Ganapathysubramanian, Arti Singh, and Soumik Sarkar. An explainable deep machine vision framework for plant stress phenotyping. Proceedings of the National Academy of Sciences, 115(18):4613–4618, 2018.
- Olsen et al. [2019] Alex Olsen, Dmitry A Konovalov, Bronson Philippa, Peter Ridd, Jake C Wood, Jamie Johns, Wesley Banks, Benjamin Girgenti, Owen Kenny, James Whinney, et al. Deepweeds: A multiclass weed species image dataset for deep learning. Scientific reports, 9(1):2058, 2019.
- Dalal [Accessed: 2024-07-15] Tarun Dalal. Dangerous insects dataset. https://www.kaggle.com/datasets/tarundalal/dangerous-insects-dataset, Accessed: 2024-07-15.
- Tolgahayit [Accessed: 2024-07-15a] Tolgahayit. Yellow rust disease in wheat. https://www.kaggle.com/datasets/tolgahayit/yellowrust19-yellow-rust-disease-in-wheat, Accessed: 2024-07-15a.
- Hayit et al. [2021] Tolga Hayit, Hasan Erbay, Fatih Varçın, Fatma Hayit, and Nilüfer Akci. Determination of the severity level of yellow rust disease in wheat by using convolutional neural networks. Journal of plant pathology, 103(3):923–934, 2021.
- Hayıt et al. [2023] Tolga Hayıt, Hasan Erbay, Fatih Varçın, Fatma Hayıt, and Nilüfer Akci. The classification of wheat yellow rust disease based on a combination of textural and deep features. Multimedia Tools and Applications, 82(30):47405–47423, 2023.
- Tolgahayit [Accessed: 2024-07-15b] Tolgahayit. Fusarium wilt disease in chickpea dataset. https://www.kaggle.com/datasets/tolgahayit/fusarium-wilt-disease-in-chickpea-dataset, Accessed: 2024-07-15b.
- Hayit et al. [2024a] Tolga Hayit, Ali Endes, and Fatma Hayit. Knn-based approach for the classification of fusarium wilt disease in chickpea based on color and texture features. European Journal of Plant Pathology, 168(4):665–681, 2024a.
- Hayit et al. [2024b] Tolga Hayit, Ali Endes, and Fatma Hayit. The severity level classification of fusarium wilt of chickpea by pre-trained deep learning models. Journal of Plant Pathology, 106(1):93–105, 2024b.
- Naik et al. [2017] Hsiang Sing Naik, Jiaoping Zhang, Alec Lofquist, Teshale Assefa, Soumik Sarkar, David Ackerman, Arti Singh, Asheesh K Singh, and Baskar Ganapathysubramanian. A real-time phenotyping framework using machine learning for plant stress severity rating in soybean. Plant methods, 13:1–12, 2017.
- Nieuwenhuizen et al. [2019] AT Nieuwenhuizen, J Hemming, Dirk Janssen, HK Suh, L Bosmans, V Sluydts, N Brenard, E Rodríguez, and MDM Tellez. Raw data from yellow sticky traps with insects for training of deep learning convolutional neural network for object detection. Wageningen University & Research, 2019.
- Fakhrealam9537 [Accessed: 2024-07-15] Fakhrealam9537. Leaf disease segmentation dataset. https://www.kaggle.com/datasets/fakhrealam9537/leaf-disease-segmentation-dataset, Accessed: 2024-07-15.
- Singh et al. [2020] Davinder Singh, Naman Jain, Pranjali Jain, Pratik Kayal, Sudhakar Kumawat, and Nipun Batra. Plantdoc: A dataset for visual plant disease detection. In Proceedings of the 7th ACM IKDD CoDS and 25th COMAD, CoDS COMAD 2020, page 249–253, New York, NY, USA, 2020. Association for Computing Machinery. ISBN 9781450377386. doi: 10.1145/3371158.3371196. URL https://doi.org/10.1145/3371158.3371196.
- openai [Accessed 15-07-2024] openai. GPT-4V(ision) System Card. https://cdn.openai.com/contributions/gpt-4v.pdf, Accessed 15-07-2024.
- Anthropic [Accessed 15-07-2024a] Anthropic. Claude 3.5 sonnet model card addendum. https://www-cdn.anthropic.com/fed9cc193a14b84131812372d8d5857f8f304c52/Model_Card_Claude_3_Addendum.pdf, Accessed 15-07-2024a.
- Reid et al. [2024] Machel Reid, Nikolay Savinov, Denis Teplyashin, Dmitry Lepikhin, Timothy Lillicrap, Jean-baptiste Alayrac, Radu Soricut, Angeliki Lazaridou, Orhan Firat, Julian Schrittwieser, et al. Gemini 1.5: Unlocking multimodal understanding across millions of tokens of context. arXiv preprint arXiv:2403.05530, 2024.
- Anthropic [Accessed 15-07-2024b] Anthropic. The claude 3 model family: Opus, sonnet, haiku. https://www-cdn.anthropic.com/f2986af8d052f26236f6251da62d16172cfabd6e/claude-3-model-card.pdf, Accessed 15-07-2024b.
- Liu et al. [2024] Haotian Liu, Chunyuan Li, Qingyang Wu, and Yong Jae Lee. Visual instruction tuning. Advances in neural information processing systems, 36, 2024.
- Mosbach et al. [2023] Marius Mosbach, Tiago Pimentel, Shauli Ravfogel, Dietrich Klakow, and Yanai Elazar. Few-shot fine-tuning vs. in-context learning: A fair comparison and evaluation. arXiv preprint arXiv:2305.16938, 2023.
- Koklu [Accessed: 2024-07-15] Murat Koklu. Durum wheat dataset. https://www.kaggle.com/datasets/muratkokludataset/durum-wheat-dataset, Accessed: 2024-07-15.
- Imsparsh [Accessed: 2024-07-15] Imsparsh. Deepweeds. https://www.kaggle.com/datasets/imsparsh/deepweeds, Accessed: 2024-07-15.
S1 Supplementary Material
This section provides additional details about the datasets used in this study, including their names, links, and the classes they contain.
S1.1 Prompts
For identification tasks, we used a universal prompt template, which was provided in the prompt engineering section, asking models to identify the class from a given list and provide the answer in JSON format. For classification and quantification tasks, we employed specialized prompts tailored to each dataset’s requirements. These prompts included specific instructions on rating scales or counting methods relevant to the task at hand.
IDC Dataset:
Analyze this image of a soybean canopy to determine the iron deficiency chlorosis (IDC) severity rating. The images are of soybean plants exhibiting various levels of IDC symptoms, ranging from healthy green plants to those with severe chlorosis and necrosis. Evaluate the extent of yellowing and browning in the canopy. Provide your answer in the following JSON format:{{"prediction": "number"}}Replace "number" with your best estimate of the IDC severity rating based on your analysis of the image.The number should be entered exactly as a whole number (without any symbols) in a range of {expected_classes}. Higher value means more severity.The response should start with {{ and contain only a JSON object (as specified above) and no other text.
Insect Count:
Analyze this image of a yellow sticky insect trap. Count the total number of visible insects caught on the trap. Only look for insects which are easily visible to naked eye and look bigger compared to the other background artifacts. Provide your answer in the following JSON format:{"prediction": "number"}Replace "number" with your best estimate of the total insect count based on your analysis of the image. The number should be entered exactly as a whole number (without any symbols) in a range of {expected_classes} The response should start with { and contain only a JSON object (as specified above) and no other text.
PlantDoc (Disease Quantification)
Analyze this image of a leaf to get the total percentage of affected leaf. The images are of several plant leaf-like Apple Scab Leaf, Apple rust leaf, Bell_pepper leaf spot, Corn leaf blight, Potato leaf early blight, etc. The affected area is: diseased leaf area / total image area. Provide your answer in the following JSON format:{"prediction": "number"}Replace "number" with your best estimate of the percent on your analysis of the image. The number should be entered exactly as a whole number (without any symbols) in a range of {expected_classes} The response should start with { and contain only a JSON object (as specified above) and no other text.
S1.2 Additional dataset details
Table S1 provides a comprehensive overview of the datasets used in the AgEval benchmark. It categorizes each dataset based on its primary task (Identification, Classification, or Quantification) and subcategory (e.g., Seed Morphology, Foliar Stress, Pests). The table includes key information such as the number of images, classes, year of creation, geographical location, and the evaluation metric used. This diverse collection of datasets covers various aspects of plant stress phenotyping, ranging from seed quality assessment to disease severity classification across different crops and regions.
| Dataset | Category | Subcategory | Description | # of Images | # of Classes | Year | Location | Metric |
|---|---|---|---|---|---|---|---|---|
| Durum Wheat [40, 16] | I | Seed Morphology | Wheat variety identification | 333 | 3 | 2019 | Turkey | F1 |
| Soybean Seeds [17] | I | Seed Morphology | Soybean quality prediction | 5513 | 5 | N/A | N/A | F1 |
| Mango Leaf Disease [18, 19] | I | Foliar Stress | Mango leaf disease classification | 4000 | 8 | 2022 | Bangladesh | F1 |
| Bean Leaf Lesions [20] | I | Foliar Stress | Bean leaf lesion type classification | 1171 | 3 | N/A | N/A | F1 |
| Soybean Diseases [21] | I | Foliar Stress | Soybean stress identification | 25,000 | 9 | 2016 | United States | F1 |
| Dangerous Insects [23] | I | Pests | Harmful insects identification | 1591 | 15 | N/A | N/A | F1 |
| DeepWeeds [41, 22] | I | Pests | Weeds species identification | 17,509 | 9 | 2019 | Australia | F1 |
| Yellow Rust 19 [24, 25, 26] | C | Disease Severity | Wheat yellow rust severity | 20,421 | 6 | 2021 | Turkey | NMAE |
| FUSARIUM 22 [27, 28, 29] | C | Disease Severity | Chickpea fusarium wilt severity | 19,339 | 5 | 2023 | Turkey | NMAE |
| IDC [30] | C | Stress Tolerance | Soybean stress severity | 1,972 | 5 | 2015 | United States | NMAE |
| InsectCount [31] | Q | Pest Count | Insect count in images | 1204 | - | 2021-2022 | N/A | NMAE |
| PlantDoc [32, 33] | Q | Disease | Percentage of the leaf that is diseased | 1176 | - | N/A | N/A | NMAE |
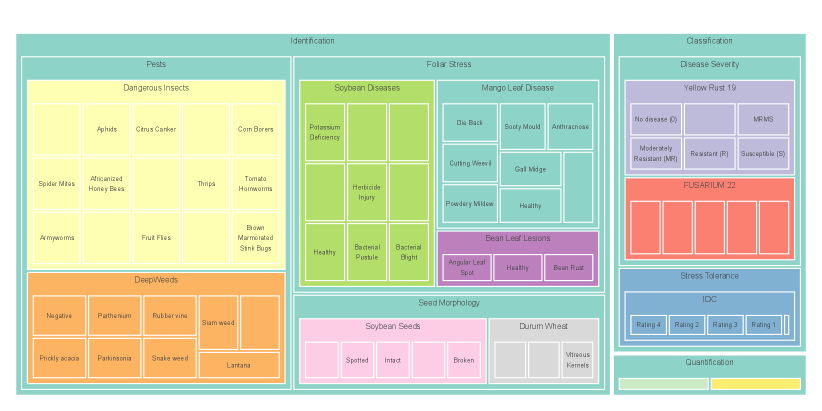
Figure S1 provides a treemap visualization of the AgEval benchmark datasets, illustrating the distribution and hierarchy of tasks, subcategories, and individual classes. This comprehensive view highlights the diverse range of plant stress-related challenges addressed by AgEval, for all the AgEval benchmark. The size of each rectangle corresponds to the number of instances in that class, offering insights into the dataset composition and balance. We sampled 100 images in total from each dataset and the size corresponds to the resulting number of instances per class in each dataset used to build AgEval.
S1.3 Additional details on intra-task uniformity
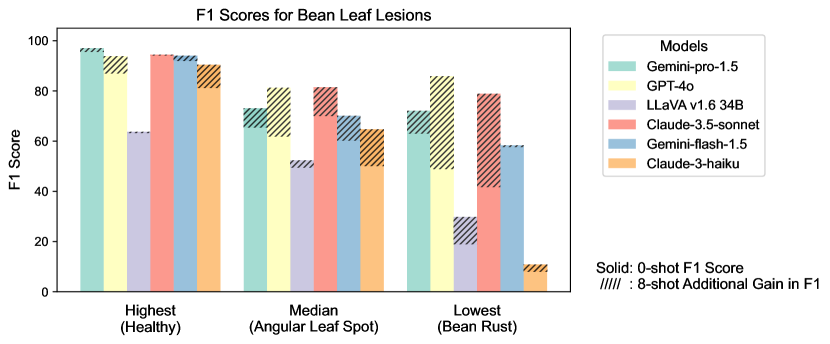
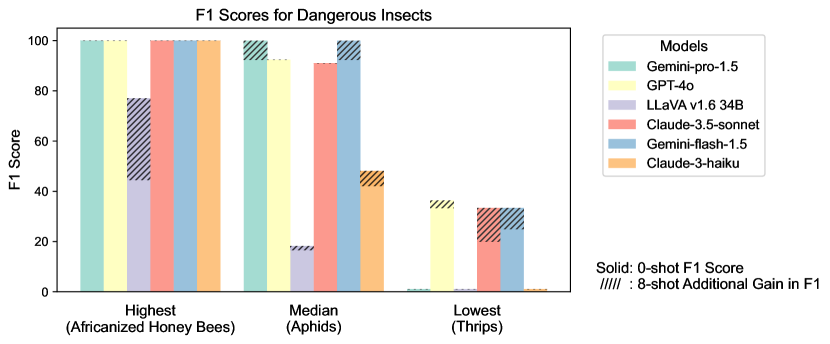
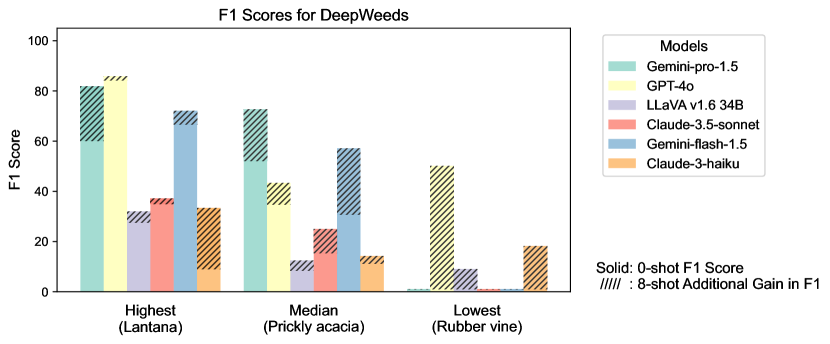
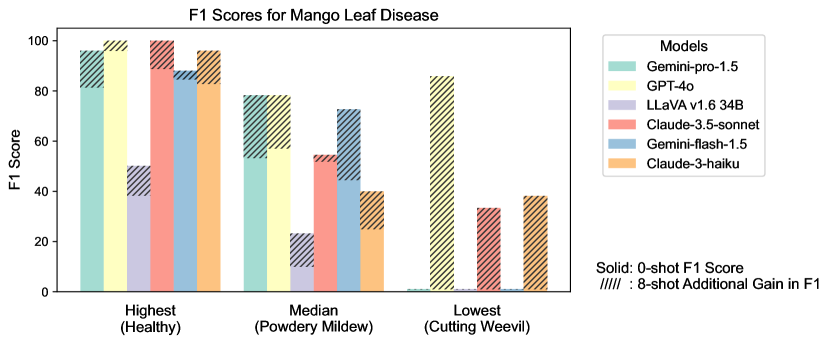
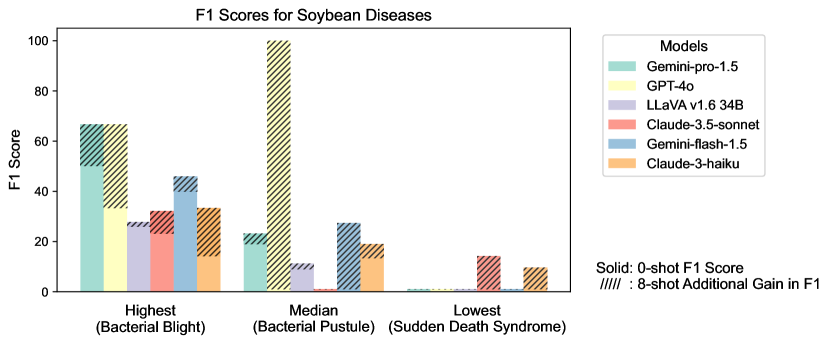
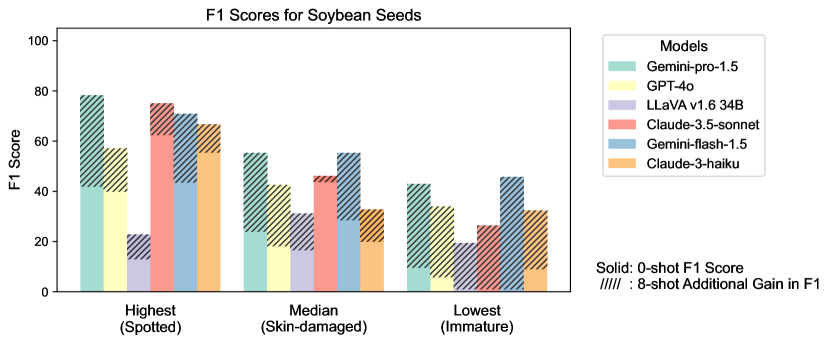
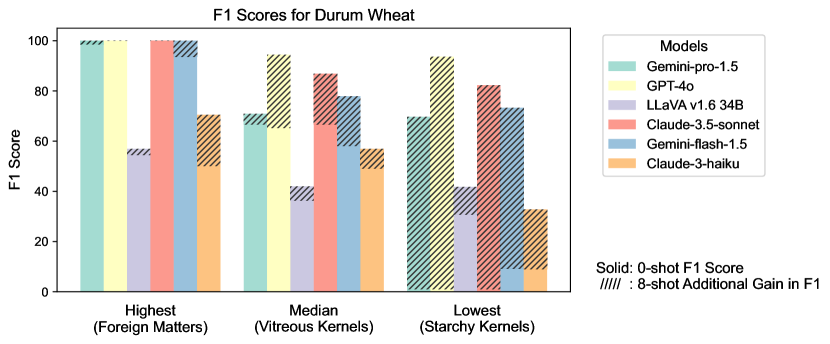
Figure S2 provides a detailed examination of intra-task uniformity across different datasets in the AgEval benchmark. Each subfigure represents a specific dataset, showcasing the F1 scores for the highest, median, and lowest performing classes based on 0-shot performance. The visualization for each class displays both the 0-shot F1 score (solid bars) and the additional gain in F1 score achieved with 8-shot learning (hatched bars) for all six evaluated models. This comprehensive view highlights the significant performance disparities among classes within each task, supporting our finding that the coefficient of variance (CV) ranges from 26.02% to 58.03% across models. The stark differences between the highest and lowest performing classes underscore the need for subject matter expertise to achieve reliable performance, especially for ”difficult” classes.
S1.4 Anecdotal Samples from Each Task:
Two samples and their corresponding predictions with respect to 0 and 8 shot are provided later. Please note that the questions are for illustration and actual prompts provided are in Section S1.1
What wheat variety is this?
![[Uncaptioned image]](https://cdn.awesomepapers.org/papers/b29dbbeb-aaf5-4f67-bf50-0b9fdfa88644/Frame_0026.jpg)
| Category | Subcategory | Task |
| Identification (I) | Seed Morphology | Durum Wheat |
Ground Truth: Foreign Matters
Predictions:
| Model Name | 0 shot | 8 shot |
|---|---|---|
| Gemini-pro-1.5 | Foreign Matters | Foreign Matters |
| GPT-4o | Foreign Matters | Foreign Matters |
| LLaVA v1.6 34B | Starchy Kernels | Vitreous Kernels |
| Claude-3.5-sonnet | Foreign Matters | Foreign Matters |
| Gemini-flash-1.5 | Foreign Matters | Foreign Matters |
| Claude-3-haiku | Vitreous Kernels | Vitreous Kernels |
What wheat variety is this?
![[Uncaptioned image]](https://cdn.awesomepapers.org/papers/b29dbbeb-aaf5-4f67-bf50-0b9fdfa88644/Frame_0019.jpg)
| Category | Subcategory | Task |
| Identification (I) | Seed Morphology | Durum Wheat |
Ground Truth: Starchy Kernels
Predictions:
| Model Name | 0 shot | 8 shot |
|---|---|---|
| Gemini-pro-1.5 | Vitreous Kernels | Starchy Kernels |
| GPT-4o | Vitreous Kernels | Starchy Kernels |
| LLaVA v1.6 34B | Vitreous Kernels | Vitreous Kernels |
| Claude-3.5-sonnet | Vitreous Kernels | Starchy Kernels |
| Gemini-flash-1.5 | Vitreous Kernels | Vitreous Kernels |
| Claude-3-haiku | Vitreous Kernels | Vitreous Kernels |
What is the quality of the soybean seed?
![[Uncaptioned image]](https://cdn.awesomepapers.org/papers/b29dbbeb-aaf5-4f67-bf50-0b9fdfa88644/95.jpg)
| Category | Subcategory | Task |
| Identification (I) | Seed Morphology | Soybean Seeds |
Ground Truth: Intact
Predictions:
| Model Name | 0 shot | 8 shot |
|---|---|---|
| Gemini-pro-1.5 | Spotted | Intact |
| GPT-4o | Spotted | Intact |
| LLaVA v1.6 34B | Immature | Intact |
| Claude-3.5-sonnet | Spotted | Intact |
| Gemini-flash-1.5 | Intact | Spotted |
| Claude-3-haiku | Intact | Intact |
What is the quality of the soybean seed?
![[Uncaptioned image]](https://cdn.awesomepapers.org/papers/b29dbbeb-aaf5-4f67-bf50-0b9fdfa88644/493.jpg)
| Category | Subcategory | Task |
| Identification (I) | Seed Morphology | Soybean Seeds |
Ground Truth: Spotted
Predictions:
| Model Name | 0 shot | 8 shot |
|---|---|---|
| Gemini-pro-1.5 | Skin-damaged | Spotted |
| GPT-4o | Skin-damaged | Skin-damaged |
| LLaVA v1.6 34B | Skin-damaged | nan |
| Claude-3.5-sonnet | Spotted | Spotted |
| Gemini-flash-1.5 | Skin-damaged | Spotted |
| Claude-3-haiku | Skin-damaged | Spotted |
What mango leaf disease is present?
![[Uncaptioned image]](https://cdn.awesomepapers.org/papers/b29dbbeb-aaf5-4f67-bf50-0b9fdfa88644/IMG_20211011_152955_Custom.jpg)
| Category | Subcategory | Task |
| Identification (I) | Foliar Stress | Mango Leaf Disease |
Ground Truth: Anthracnose
Predictions:
| Model Name | 0 shot | 8 shot |
|---|---|---|
| Gemini-pro-1.5 | Cutting Weevil | Bacterial Canker |
| GPT-4o | Cutting Weevil | Gall Midge |
| LLaVA v1.6 34B | Other | Anthracnose |
| Claude-3.5-sonnet | Cutting Weevil | Die Back |
| Gemini-flash-1.5 | nan | Anthracnose |
| Claude-3-haiku | Die Back | Anthracnose |
What mango leaf disease is present?
![[Uncaptioned image]](https://cdn.awesomepapers.org/papers/b29dbbeb-aaf5-4f67-bf50-0b9fdfa88644/20211129_164418_Custom.jpg)
| Category | Subcategory | Task |
| Identification (I) | Foliar Stress | Mango Leaf Disease |
Ground Truth: Die Back
Predictions:
| Model Name | 0 shot | 8 shot |
|---|---|---|
| Gemini-pro-1.5 | nan | nan |
| GPT-4o | Die Back | Die Back |
| LLaVA v1.6 34B | Die Back | Bacterial Canker |
| Claude-3.5-sonnet | Die Back | Die Back |
| Gemini-flash-1.5 | nan | nan |
| Claude-3-haiku | Die Back | Die Back |
What type of bean leaf lesion is this?
![[Uncaptioned image]](https://cdn.awesomepapers.org/papers/b29dbbeb-aaf5-4f67-bf50-0b9fdfa88644/angular_leaf_spot_train.296.jpg)
| Category | Subcategory | Task |
| Identification (I) | Foliar Stress | Bean Leaf Lesions |
Ground Truth: Angular Leaf Spot
Predictions:
| Model Name | 0 shot | 8 shot |
|---|---|---|
| Gemini-pro-1.5 | Angular Leaf Spot | Bean Rust |
| GPT-4o | Angular Leaf Spot | Angular Leaf Spot |
| LLaVA v1.6 34B | Bean Rust | Angular Leaf Spot |
| Claude-3.5-sonnet | Angular Leaf Spot | Angular Leaf Spot |
| Gemini-flash-1.5 | Angular Leaf Spot | Angular Leaf Spot |
| Claude-3-haiku | Angular Leaf Spot | Angular Leaf Spot |
What type of bean leaf lesion is this?
![[Uncaptioned image]](https://cdn.awesomepapers.org/papers/b29dbbeb-aaf5-4f67-bf50-0b9fdfa88644/healthy_train.189.jpg)
| Category | Subcategory | Task |
| Identification (I) | Foliar Stress | Bean Leaf Lesions |
Ground Truth: Healthy
Predictions:
| Model Name | 0 shot | 8 shot |
|---|---|---|
| Gemini-pro-1.5 | Healthy | Healthy |
| GPT-4o | Healthy | Healthy |
| LLaVA v1.6 34B | Healthy | Angular Leaf Spot |
| Claude-3.5-sonnet | Healthy | Bean Rust |
| Gemini-flash-1.5 | Healthy | Healthy |
| Claude-3-haiku | Healthy | Healthy |
What is the type of stress in this soybean?
![[Uncaptioned image]](https://cdn.awesomepapers.org/papers/b29dbbeb-aaf5-4f67-bf50-0b9fdfa88644/50606.png)
| Category | Subcategory | Task |
| Identification (I) | Foliar Stress | Soybean Diseases |
Ground Truth: Frogeye Leaf Spot
Predictions:
| Model Name | 0 shot | 8 shot |
|---|---|---|
| Gemini-pro-1.5 | Healthy | Potassium Deficiency |
| GPT-4o | Bacterial Pustule | Bacterial Blight |
| LLaVA v1.6 34B | Healthy | Iron Deficiency Chlorosis |
| Claude-3.5-sonnet | Healthy | Healthy |
| Gemini-flash-1.5 | Healthy | Healthy |
| Claude-3-haiku | Potassium Deficiency | Potassium Deficiency |
What is the type of stress in this soybean?
![[Uncaptioned image]](https://cdn.awesomepapers.org/papers/b29dbbeb-aaf5-4f67-bf50-0b9fdfa88644/43242.png)
| Category | Subcategory | Task |
| Identification (I) | Foliar Stress | Soybean Diseases |
Ground Truth: Bacterial Pustule
Predictions:
| Model Name | 0 shot | 8 shot |
|---|---|---|
| Gemini-pro-1.5 | Herbicide Injury | Iron Deficiency Chlorosis |
| GPT-4o | Healthy | Bacterial Pustule |
| LLaVA v1.6 34B | Healthy | Healthy |
| Claude-3.5-sonnet | Healthy | Healthy |
| Gemini-flash-1.5 | Iron Deficiency Chlorosis | Healthy |
| Claude-3-haiku | Frogeye Leaf Spot | Sudden Death Syndrome |
What is the name of this harmful insect?
![[Uncaptioned image]](https://cdn.awesomepapers.org/papers/b29dbbeb-aaf5-4f67-bf50-0b9fdfa88644/Image_64.jpg)
| Category | Subcategory | Task |
| Identification (I) | Invasive Species | Dangerous Insects |
Ground Truth: Cabbage Loopers
Predictions:
| Model Name | 0 shot | 8 shot |
|---|---|---|
| Gemini-pro-1.5 | Cabbage Loopers | Cabbage Loopers |
| GPT-4o | Cabbage Loopers | Cabbage Loopers |
| LLaVA v1.6 34B | Cabbage Loopers | nan |
| Claude-3.5-sonnet | Cabbage Loopers | Cabbage Loopers |
| Gemini-flash-1.5 | Cabbage Loopers | Cabbage Loopers |
| Claude-3-haiku | Aphids | Tomato Hornworms |
What is the name of this harmful insect?
![[Uncaptioned image]](https://cdn.awesomepapers.org/papers/b29dbbeb-aaf5-4f67-bf50-0b9fdfa88644/Image_39.jpg)
| Category | Subcategory | Task |
| Identification (I) | Invasive Species | Dangerous Insects |
Ground Truth: Fall Armyworms
Predictions:
| Model Name | 0 shot | 8 shot |
|---|---|---|
| Gemini-pro-1.5 | Armyworms | Armyworms |
| GPT-4o | Cabbage Loopers | Armyworms |
| LLaVA v1.6 34B | Cabbage Loopers | nan |
| Claude-3.5-sonnet | Armyworms | Armyworms |
| Gemini-flash-1.5 | Fall Armyworms | Armyworms |
| Claude-3-haiku | Armyworms | nan |
What is the name of this weed?
![[Uncaptioned image]](https://cdn.awesomepapers.org/papers/b29dbbeb-aaf5-4f67-bf50-0b9fdfa88644/20171025-082439-1.jpg)
| Category | Subcategory | Task |
| Identification (I) | Invasive Species | DeepWeeds |
Ground Truth: Chinee apple
Predictions:
| Model Name | 0 shot | 8 shot |
|---|---|---|
| Gemini-pro-1.5 | Chinee apple | Chinee apple |
| GPT-4o | Chinee apple | Chinee apple |
| LLaVA v1.6 34B | Parthenium | Parkinsonia |
| Claude-3.5-sonnet | Lantana | Lantana |
| Gemini-flash-1.5 | Prickly acacia | Chinee apple |
| Claude-3-haiku | Parthenium | Parthenium |
What is the name of this weed?
![[Uncaptioned image]](https://cdn.awesomepapers.org/papers/b29dbbeb-aaf5-4f67-bf50-0b9fdfa88644/20170920-110443-2.jpg)
| Category | Subcategory | Task |
| Identification (I) | Invasive Species | DeepWeeds |
Ground Truth: Parkinsonia
Predictions:
| Model Name | 0 shot | 8 shot |
|---|---|---|
| Gemini-pro-1.5 | nan | nan |
| GPT-4o | Parthenium | Negative |
| LLaVA v1.6 34B | nan | Snake weed |
| Claude-3.5-sonnet | Snake weed | Parthenium |
| Gemini-flash-1.5 | nan | Siam weed |
| Claude-3-haiku | Parthenium | Snake weed |
What is the severity of yellow rust disease?
![[Uncaptioned image]](https://cdn.awesomepapers.org/papers/b29dbbeb-aaf5-4f67-bf50-0b9fdfa88644/3_MRMS_827.jpg)
| Category | Subcategory | Task |
| Classification (C) | Disease Severity | Yellow Rust 19 |
Ground Truth: MRMS
Predictions:
| Model Name | 0 shot | 8 shot |
|---|---|---|
| Gemini-pro-1.5 | Moderately Resistant (MR) | Moderately Resistant (MR) |
| GPT-4o | Moderately Susceptible (MS) | Moderately Resistant (MR) |
| LLaVA v1.6 34B | Susceptible (S) | No disease (0) |
| Claude-3.5-sonnet | Moderately Resistant (MR) | No disease (0) |
| Gemini-flash-1.5 | Moderately Resistant (MR) | MRMS |
| Claude-3-haiku | Susceptible (S) | Moderately Resistant (MR) |
What is the severity of yellow rust disease?
![[Uncaptioned image]](https://cdn.awesomepapers.org/papers/b29dbbeb-aaf5-4f67-bf50-0b9fdfa88644/1_R_814.jpg)
| Category | Subcategory | Task |
| Classification (C) | Disease Severity | Yellow Rust 19 |
Ground Truth: Resistant (R)
Predictions:
| Model Name | 0 shot | 8 shot |
|---|---|---|
| Gemini-pro-1.5 | Moderately Resistant (MR) | Susceptible (S) |
| GPT-4o | Moderately Resistant (MR) | Moderately Susceptible (MS) |
| LLaVA v1.6 34B | Susceptible (S) | Moderately Susceptible (MS) |
| Claude-3.5-sonnet | Moderately Susceptible (MS) | Moderately Susceptible (MS) |
| Gemini-flash-1.5 | Moderately Resistant (MR) | Moderately Susceptible (MS) |
| Claude-3-haiku | Moderately Susceptible (MS) | MRMS |
What is the rating (1-5) of soybean stress severity?
![[Uncaptioned image]](https://cdn.awesomepapers.org/papers/b29dbbeb-aaf5-4f67-bf50-0b9fdfa88644/3436-p.jpg)
| Category | Subcategory | Task |
| Classification (C) | Stress Tolerance | IDC |
Ground Truth: 1
Predictions:
| Model Name | 0 shot | 8 shot |
|---|---|---|
| Gemini-pro-1.5 | 1.0 | 1.0 |
| GPT-4o | 3 | 1 |
| LLaVA v1.6 34B | 4.0 | nan |
| Claude-3.5-sonnet | 2.0 | 2 |
| Gemini-flash-1.5 | 1 | 2 |
| Claude-3-haiku | 1.0 | 3.0 |
What is the rating (1-5) of soybean stress severity?
![[Uncaptioned image]](https://cdn.awesomepapers.org/papers/b29dbbeb-aaf5-4f67-bf50-0b9fdfa88644/3041-p.jpg)
| Category | Subcategory | Task |
| Classification (C) | Stress Tolerance | IDC |
Ground Truth: 2
Predictions:
| Model Name | 0 shot | 8 shot |
|---|---|---|
| Gemini-pro-1.5 | 2.0 | 4.0 |
| GPT-4o | 4 | 2 |
| LLaVA v1.6 34B | 3.0 | nan |
| Claude-3.5-sonnet | 3.0 | 3 |
| Gemini-flash-1.5 | 2 | 3 |
| Claude-3-haiku | 1.0 | 3.0 |
What is the severity of chickpea fusarium wilt?
![[Uncaptioned image]](https://cdn.awesomepapers.org/papers/b29dbbeb-aaf5-4f67-bf50-0b9fdfa88644/IMG_2929.jpg)
| Category | Subcategory | Task |
| Classification (C) | Stress Tolerance | FUSARIUM 22 |
Ground Truth: Resistant
Predictions:
| Model Name | 0 shot | 8 shot |
|---|---|---|
| Gemini-pro-1.5 | Susceptible | Resistant |
| GPT-4o | Highly Susceptible | Highly Resistant |
| LLaVA v1.6 34B | Highly Susceptible | nan |
| Claude-3.5-sonnet | Susceptible | Moderately Resistant |
| Gemini-flash-1.5 | Moderately Resistant | Moderately Resistant |
| Claude-3-haiku | Resistant | Resistant |
What is the severity of chickpea fusarium wilt?
![[Uncaptioned image]](https://cdn.awesomepapers.org/papers/b29dbbeb-aaf5-4f67-bf50-0b9fdfa88644/IMG_3184.jpg)
| Category | Subcategory | Task |
| Classification (C) | Stress Tolerance | FUSARIUM 22 |
Ground Truth: Susceptible
Predictions:
| Model Name | 0 shot | 8 shot |
|---|---|---|
| Gemini-pro-1.5 | Susceptible | Susceptible |
| GPT-4o | Highly Susceptible | Highly Susceptible |
| LLaVA v1.6 34B | Resistant | nan |
| Claude-3.5-sonnet | Susceptible | Highly Susceptible |
| Gemini-flash-1.5 | Highly Susceptible | Highly Susceptible |
| Claude-3-haiku | Susceptible | Moderately Resistant |
What is the insect count?
![[Uncaptioned image]](https://cdn.awesomepapers.org/papers/b29dbbeb-aaf5-4f67-bf50-0b9fdfa88644/August-11-2022-1_jpg.rf.98f2fe6f84ce7ad4db3ee815ad468dac.jpg)
| Category | Subcategory | Task |
| Quantification (Q) | Pest | InsectCount |
Ground Truth: 2
Predictions:
| Model Name | 0 shot | 8 shot |
|---|---|---|
| Gemini-pro-1.5 | 10 | 5.0 |
| GPT-4o | 6 | 9 |
| LLaVA v1.6 34B | 7.0 | 4.0 |
| Claude-3.5-sonnet | 8 | 3 |
| Gemini-flash-1.5 | 4 | 6 |
| Claude-3-haiku | 17.0 | 17.0 |
What is the insect count?
![[Uncaptioned image]](https://cdn.awesomepapers.org/papers/b29dbbeb-aaf5-4f67-bf50-0b9fdfa88644/August-11-2022-102_jpg.rf.59551abdc40ff06bbf52223b63e7e4d3.jpg)
| Category | Subcategory | Task |
| Quantification (Q) | Pest | InsectCount |
Ground Truth: 1
Predictions:
| Model Name | 0 shot | 8 shot |
|---|---|---|
| Gemini-pro-1.5 | 8 | 8.0 |
| GPT-4o | 9 | 2 |
| LLaVA v1.6 34B | 0.0 | 11.0 |
| Claude-3.5-sonnet | 15 | 0 |
| Gemini-flash-1.5 | 1 | 2 |
| Claude-3-haiku | 22.0 | 3.0 |
What is the diseased leaf percentage?
![[Uncaptioned image]](https://cdn.awesomepapers.org/papers/b29dbbeb-aaf5-4f67-bf50-0b9fdfa88644/00118.jpg)
| Category | Subcategory | Task |
| Quantification (Q) | Disease | PlantDoc |
Ground Truth: 3
Predictions:
| Model Name | 0 shot | 8 shot |
|---|---|---|
| Gemini-pro-1.5 | 10.0 | 3.0 |
| GPT-4o | 7 | 8 |
| LLaVA v1.6 34B | 5.0 | 7.0 |
| Claude-3.5-sonnet | 12 | 4 |
| Gemini-flash-1.5 | 5 | 4 |
| Claude-3-haiku | 19.0 | 3.0 |
What is the diseased leaf percentage?
![[Uncaptioned image]](https://cdn.awesomepapers.org/papers/b29dbbeb-aaf5-4f67-bf50-0b9fdfa88644/00097.jpg)
| Category | Subcategory | Task |
| Quantification (Q) | Disease | PlantDoc |
Ground Truth: 12
Predictions:
| Model Name | 0 shot | 8 shot |
|---|---|---|
| Gemini-pro-1.5 | 10.0 | 5.0 |
| GPT-4o | 18 | 12 |
| LLaVA v1.6 34B | 10.0 | nan |
| Claude-3.5-sonnet | 23 | 15 |
| Gemini-flash-1.5 | 32 | 12 |
| Claude-3-haiku | 18.0 | 30.0 |