AEVA: Black-box Backdoor Detection Using Adversarial Extreme Value Analysis
Abstract
Deep neural networks (DNNs) are proved to be vulnerable against backdoor attacks. A backdoor is often embedded in the target DNNs through injecting a backdoor trigger into training examples, which can cause the target DNNs misclassify an input attached with the backdoor trigger. Existing backdoor detection methods often require the access to the original poisoned training data, the parameters of the target DNNs, or the predictive confidence for each given input, which are impractical in many real-world applications, e.g., on-device deployed DNNs. We address the black-box hard-label backdoor detection problem where the DNN is fully black-box and only its final output label is accessible. We approach this problem from the optimization perspective and show that the objective of backdoor detection is bounded by an adversarial objective. Further theoretical and empirical studies reveal that this adversarial objective leads to a solution with highly skewed distribution; a singularity is often observed in the adversarial map of a backdoor-infected example, which we call the adversarial singularity phenomenon. Based on this observation, we propose the adversarial extreme value analysis (AEVA) to detect backdoors in black-box neural networks. AEVA is based on an extreme value analysis of the adversarial map, computed from the monte-carlo gradient estimation. Evidenced by extensive experiments across multiple popular tasks and backdoor attacks, our approach is shown effective in detecting backdoor attacks under the black-box hard-label scenarios.
1 Introduction
Deep Neural Networks (DNNs) have pervasively been used in a wide range of applications such as facial recognition (Masi et al., 2018), object detection (Szegedy et al., 2013; Li et al., 2022), autonomous driving (Okuyama et al., 2018), and home assistants (Singh et al., 2020; Zhai et al., 2021). In the meanwhile, DNNs become increasingly complex. Training state-of-the-art models requires enormous data and expensive computation. To address this problem, vendors and developers start to provide pre-trained DNN models. Similar to softwares shared on GitHub, pre-trained DNN models are being published and shared on online venues like the BigML model market, ONNX zoo and Caffe model zoo.
Since the dawn of software distribution, there has been an ongoing war between publishers sneaking malicious code and backdoors in their software and security personnel detecting them. Recent studies show that DNN models can contain similar backdoors, which are induced due to contaminated training data. Sometimes models containing backdoors can perform better than the regular models under untampered test inputs. However, under inputs tampered with a specific pattern (called trojan trigger) models containing backdoors can suffer from significant accuracy loss.
There has been a significant amount of recent work on detecting the backdoor triggers. However, those solutions require access to the original poisoned training data (Chen et al., 2019a; Tran et al., 2018; Huang et al., 2022), the parameters of the trained model (Chen et al., 2019b; Guo et al., 2020; Liu et al., 2019; Wang et al., 2019; 2020; Dong et al., 2021; Kolouri et al., 2020), or the predicted confidence score of each class (Dong et al., 2021). Unfortunately, it is costly and often impractical for the defender to access the original poisoned training dataset. In situations when DNNs are deployed in safety-critical platforms (Fowers et al., 2018; Okuyama et al., 2018; Li et al., 2021b) or in cloud services (Fowers et al., 2018; Chen et al., 2019c), it is also impractical to access either their parameters or the predicted confidence score of each class (Chen et al., 2019c; 2020b).
We present the black-box hard-label backdoor detection problem where the DNN is a fully black-box and only its final output label is accessible (Fig. 1). Detecting backdoor-infected DNNs in such black-box setting becomes critical due to the emerging model deployment in embedded devices and remote cloud servers.

In this setting, the typical optimization objective of backdoor detection (Chen et al., 2019b; Liu et al., 2019) becomes impossible to solve due to the limited information. However, according to a theoretical analysis, we show that the backdoor objective is bounded by an adversarial objective, which can be optimized using Monte Carlo gradient estimation in our black-box hard-label setup. Further theoretical and empirical studies reveal that this adversarial objective leads to a solution with highly skewed distribution; a singularity is likely to be observed in the adversarial map of a backdoor-infected example, which we call the adversarial singularity phenomenon.
Based on these findings, we propose the adversarial extreme value analysis (AEVA) algorithm to detect backdoors in black-box neural networks. The AEVA algorithm is based on an extreme value analysis (Leadbetter, 1991) on the adversarial map. We detect the adversarial singularity phenomenon by looking at the adversarial peak, i.e., maximum value of the computed adversarial perturbation map. We perform a statistical study which reveals that, there is around chance that the adversarial peak of a random sample for a backdoor-infected DNN is larger than the adversarial peak of any examples for an uninfected DNN. Inspired by the Univariate theory, we propose a global adversarial peak (GAP) value by sampling multiple examples and choosing the maximum over their adversarial peaks, to ensure a high success rate. Following previous works (Dong et al., 2021; Wang et al., 2019), the Median Absolute Deviation (MAD) algorithm is implemented on top of the GAP values to test whether a DNN is backdoor-infected.
Through extensive experiments across three popular tasks and state-of-the-art backdoor techniques, AEVA is proved to be effective in detecting backdoor attacks under the black-box hard-label scenarios. The results show that AEVA can efficiently detect backdoor-infected DNNs, yielding an overall detection accuracy across various tasks, DNN models and triggers. Rather interestingly, when comparing to two state-of-art white-box backdoor detection methods, AEVA yields comparable performance, even though AEVA is a black-box method with limited access to information.
We summarize our contributions as below 111Code :https://github.com/JunfengGo/AEVA-Blackbox-Backdoor-Detection-main:
-
1.
To the best of our knowledge, we are the first to present the black-box hard-label backdoor detection problem and provide an effective solution to this problem.
-
2.
We provide a theoretical analysis which shows backdoor detection optimization is bounded by an adversarial objective. And we further reveal the adversarial singularity phenomenon where the adversarial perturbation computed from a backdoor-infected neural network is likely to suffer from a highly skewed distribution.
-
3.
We propose a generic backdoor detection framework AEVA, optimizing the adversarial objective and performing extreme value analysis on the optimized adversarial map. AEVA is applicable to the black-box hard-label setting with a Monte Carlo gradient estimation.
-
4.
We evaluate AEVA on three widely-adopted tasks with different backdoor trigger implementations and complex black-box attack variants. All results suggest that AEVA is effective in black-box hard-label backdoor detection.
1.1 Related Work
Backdoor attacks. BadNets (Gu et al., 2019) is probably the first work on backdoor attacks against DNNs, which causes target misclassification to DNNs through injecting a small trigger into some training samples and mis-labeling these samples with a specific target class. Trojaning attack (Liu et al., 2018) generates a trigger which can cause the maximum activation value of certain selected neurons with limited training data. Chen et al. (Chen et al., 2017) further propose to perform backdoor attacks under a rather weak threat model where the attacker cannot access the target model and training dataset. Most recently, a set of backdoor attacks (Ji et al., 2018; Liu et al., 2020; Saha et al., 2020; Turner et al., 2019; Yao et al., 2019) have been proposed, which are built upon existing work but focused on various specific scenarios, e.g., physical-world, transfer learning, etc.
Backdoor detection (white-box). A few works (Chen et al., 2019a; Tran et al., 2018) are proposed to detect the backdoor samples within the training dataset. Chen et al. (2019a) propose a neuron activation clustering approach to identify backdoor samples through clustering the training data based on the neuron activation of the target DNN. Tran et al. (2018) distinguish backdoor samples from clean samples based on the spectrum of the feature covariance of the target DNN. Few other works focus on detecting backdoor-infected DNNs (Liu et al., 2019; Wang et al., 2019). ABS (Liu et al., 2019) identifies the infected DNNs by seeking compromised neurons representing the features of backdoor triggers. Neural Cleanse (Wang et al., 2019) conducts the reverse engineering to restore the trigger through solving an optimization problem. Recent works (Chen et al., 2019b; Guo et al., 2020; Wang et al., 2020) improve Neural Cleanse with better objective functions. However, these methods are all white-box based, requiring access to model parameters or internal neuron values.
Backdoor detection (black-box). A recent work (Chen et al., 2019b) claims to detect backdoor attacks in the “black-box” settings. However, their method still need the DNN’s parameters to train a separate generator (Goodfellow et al., 2014). So, strictly speaking, their method is not “black-box”, which is also revealed by (Dong et al., 2021). To the best of our knowledge, Dong et al. (2021) is the only existing work on detecting backdoor-infected DNNs in the black-box settings. However, their method requires the predictive confidence score for each input to perform the NES algorithm (Wierstra et al., 2014), which weakens its practicability. Our work differs from all previous methods in that we address a purely black-box setup where only the hard output label is accessible. Both model parameters and training examples are inaccessible in the black-box hard-label setting.
2 Preliminaries: black-box backdoor attack and defense
2.1 Threat model
Our considered threat model contains two parts: the adversary and the defender. The threat model of the adversary follows previous works (Chen et al., 2017; Gu et al., 2019; Liu et al., 2018). In this model, the attacker can inject an arbitrary amount of backdoor samples into the training dataset and cause target misclassification to a specific label without affecting the model’s accuracy on normal examples. From the perspective of the defender, we consider the threat model with the weakest assumption, in which the poisoned training dataset and the parameters of the target DNNs are inaccessible. Moreover, the defender can only obtain the final predictive label for each input from the target DNNs and a validation set (40 images for each class). Therefore, the defender can only query the target DNNs to obtain its final decisions. The defender’s goal is to identify whether the target DNNs is infected and which label is infected.
2.2 Problem definition
Consistent with prior studies (Dong et al., 2021; Kolouri et al., 2020; Wang et al., 2019; Huang et al., 2022), we deem a DNN is backdoor infected if one can make an arbitrary input misclassified as the target label, with minor modification to the input. Without loss of generability, given the original input , the modified input containing the backdoor trigger can be formulated as:
| (1) |
where represents the backdoor trigger and represents the element-wise product. is a binary mask that ensures the position and magnitude of the backdoor trigger. Typically, ought to be very small to ensure the visually-indistinguishability between and .
We define as the target DNN with parameters , which is a function that maps the input to a label . is defined as the probability that is classified as by . The argument is sometimes omitted in favor of simplicity. For to mislabel as the target label , there are two possible reasons: the backdoored training data either contains the same trigger but mislabeled as or contains similar features as the normal inputs (not belonging to , but visually similar to ) and labeled as .
| (2) |
where there are original training examples and backdoor examples. represents the cross-entropy loss function; and represent the training sample and its corresponding ground-truth label, respectively. In the inference phase, the target DNN will predict each as the target label , which can be formulated as: . Prior works (Dong et al., 2021; Wang et al., 2019; Chen et al., 2019b) seek to reveal the existence of a backdoor through investigating whether there exists a backdoor trigger with minimal that can cause misclassification to a certain label.
We mainly study the sparse mask since it is widely used in previous works (Wang et al., 2020; Dong et al., 2021; Chen et al., 2019b; Guo et al., 2020; Wang et al., 2019; Gu et al., 2019). In cases when the mask becomes dense, the mask has to contain low magnitude continuous values to ensure the backdoor examples visually indistinguishable. However, when the value of is small, every normal example becomes near the decision boundary of function . It is revealed by Taylor theorem, . And the function output label changes dramatically from to , so the gradient has to have a large magnitude, which results in a non-robust model sensitive to subtle input change. Such models become impractical because a small random perturbation on the input can lead to significantly different model output. More details with empirical study can be found in the Appendix A.
2.3 Black-box backdoor detection and its challenges
Most previous works (Wang et al., 2019; Dong et al., 2021; Chen et al., 2019b) focus on reverse-engineering the backdoor trigger for each target label using the following optimization:
| (3) |
where is the balancing parameter. Unfortunately, solving Eq. 3 is notoriously hard in the black-box hard-label setting since is unknown. Additional difficulty comes with the fact that an effective zero-th order gradient estimation requires each example superimposed with the trigger to be close to the decision boundary of (Chen et al., 2020a; Cheng et al., 2020; Li et al., 2020). However, such condition is hard to achieve in the hard-label blackbox settings.
3 Adversarial extreme value analysis for backdoor detection
Our AEVA framework is introduced in this section. We first derive an upper bound to the backdoor detection objective in Eq. 3 and find its connection to adversarial attack. The adversarial singularity phenomenon is further revealed in both theoretical results and empirical studies. Based on our findings, we propose the Global Adversarial Peak (GAP) measure, computed by extreme value analysis on the adversarial perturbation. The GAP score will be finally used with Median Absolute Deviation (MAD) to detect backdoors in neural networks. Monte Carlo gradient estimation is further introduced in order to solve the adversarial objective in the black-box setting.
3.1 Adversarial objective as an upper bound of the backdoor objective
We present in this section the connection between the backdoor objective in Eq. 3 with the objective in adversarial attacks. To begin with, we first transform the backdoor masking equation , where . Following this, the optimization in Eq. 3 converts to minimizing the following term:
| (4) |
We further introduce an important result from the Multivariate Taylor Theorem below.
Lemma 1.
Given a continuous differentiable function defined on and vectors , for any , we have .
The lemma can be proved using the Lagrange Remainder. Please refer to the Appendix B.1 for a detailed proof. According to the lemma, we have
| (5) |
where the latter inequality holds because each example is bounded and the last equality holds because is a binary mask. Then, we can see that the adversarial objective is an upper bound of the objective in backdoor detection, i.e., . Instead of optimizing the original Eq. 3, we here propose to minimize the -regularized objective. While enforces the sparsity of the solution, optimizing it is NP-hard. In practice, it is replaced with an -norm as an envelope of the objective (Ramirez et al., 2013; Donoho, 2006):
| (6) |
This adversarial optimization can be solved using Monte Carlo gradient estimation in our black-box setting. More details are described in Section 3.4. In the following, we will first discuss how the solution to this adversarial objective can be used to detect backdoors in neural networks.
3.2 The adversarial singularity phenomenon
A natural and important question here is what the adversarial perturbation would look like when the input is infected with backdoor attacks. A direct analysis on deep neural networks is hard. So, we start by analyzing a linear model to shed light on the intuition of our approach.
Lemma 2.
Given a linear model parameterized by optimized on original training examples and backdoored training examples with an objective in Eq. 2 and a mean-squared-error loss, the adversarial solution optimized using Eq. 6 will be dominated by input dimensions corresponding to backdoor mask when is large, i.e., .
The lemma can be proved by least square solutions and exact gradient computation. Detailed proof can be found in the Appendix B.2. The lemma reveals that the majority of the mass in the adversarial perturbation will be occupied in the mask area. Since the mask is usually sparse, it is reasonable to expect a highly skewed distribution in the adversarial map .
We suspect that such skewed distributions might also occur in the adversarial map of a deep neural network. While a thorough analysis on DNN is hard, recent studies in Neural Tangent Kernel (NTK) (Jacot et al., 2018) have shown that a deep neural network with infinite width can be treated as kernel least square. So, we further extended our analysis to a -way kernel least square classifier as the model and a cross-entropy loss used in the adversarial analysis.
Lemma 3.
Suppose the training dataset consists of original examples and backdoor examples, i.i.d. sampled from uniform distribution and belonging to classes. Let be a multivariate kernel regression with the objective in Eq. 2, an RBF kernel. Then the adversarial solution to Eq. 6 under cross-entropy loss should satisfy that .
The proof can be found in Appendix B.3. The lemma reveals a similar result as the linear case that the majority mass of the adversarial perturbation (in expectation) stays in the mask area when sufficient backdoor examples are used. Although the lemma does not directly address a deep neural network, we hope this result could help understand the problem better in the NTK regime.
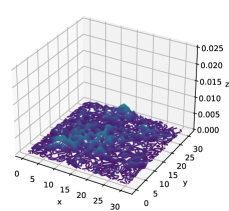
We perform an empirical study on DNNs to validate our intuition. Following previous works (Dong et al., 2021; Wang et al., 2019; 2020), we implement BadNets (Gu et al., 2019) as the backdoor attack method. We randomly select a label as the infected label and train a ResNet-44 on CIFAR-10 embedded with the backdoor attack, resulting in an attack success rate of . The backdoor trigger is a 4x4 square shown in Fig. 2(a), which occupies at most of the whole image. The adversarial perturbations (by optimizing Eq. 6) are generated for both infected and uninfected labels. The perturbations are normalized to a heat map as and shown in Fig. 2. A high concentration of mass is clearly observed from the infected case in Figure 2(b). We call it adversarial singularity phenomenon. This motivates our adversarial extreme value analysis (AEVA) method.


3.3 Adversarial extreme value analysis

A natural way to identify singularity is to look at the peak value of the distribution. We define the adversarial peak for an adversarial perturbation . To gain a statistical understanding of the relationship between adversarial peak and backdoor attacks, We randomly sample normalized for the uninfected and infected labels and plot the distribution of in Fig. 3. The experimental setup is consistent with the empirical study in Sec. 3.2. We notice from the figure that of the infected labels reaches a much larger range compared to that of uninfected labels. However, they still overlap; around infected stays within the uninfected range (the area with both blue and orange bars). This result suggests that
the adversarial singularity phenomenon does not always occur in backdoor-infected DNNs. It is reasonable because some samples are inherently vulnerable to adversarial attacks and their adversarial perturbations have similar properties as backdoors, which reduces the chance of singularity.
Now, we know if we define a threshold as the maximum value of the uninfected labels, the probability of a backdoor-infected being smaller than is , i.e., . Taking one example is impossible to know whether a label is infected. However, according to the Univariate Theory (Gomes & Guillou, 2015), if we sample examples of for the same label,
| (7) |

Here we name the maximum value over all the adversarial peaks as the Global Adversarial Peak (GAP). We vary the choice of in Figure 4 and we can see that the chance of GAP value being lower than is diminishing. For example, if we take , then and the success rate of identifying a backdoor-infected label is . Please be advised that, given the long-tail distribution of the infected , this threshold is not sensitive and can be made even larger to be safe to include all uninfected labels. However, for larger values, we need a larger to ensure a desired success rate.
3.4 Black-box optimization via gradient estimation
After investigating the unique properties of backdoor-infected DNNs in the white-box settings, we here illustrate how to exploit such properties under a rather restricted scenario as we consider. In the white-box settings, the free access to can enable us to compute the accurately, resulting in with minimum through optimizing Eq. 6. Regarding the black-box settings, we propose to leverage the zero-order gradient estimation technique (Fu & Hu, 2012) to address the challenge for calculating . We choose Monte Carlo based method (Fu & Hu, 2012) for obtaining the estimated gradient , which sends several inputs and utilizes the corresponding outputs to estimate the gradient. More details about gradient estimation can be found in Appendix C.
3.5 Final algorithm

Putting all the above ideas together, we present the AEVA framework (illustrated in Fig. 5). The algorithm for computing the GAP value of a given label is described in Algorithm 1. Our approach requires a batch of legitimate samples for each class . For each label to be analyzed, the algorithm will tell whether is backdoor-infected. We treat as the targeted label. Then we collect a batch of legitimate samples belonging to , denoted as with the same batch size as that of . Then, we leverage to make each sample within every to approach the decision boundary of . This is computed by optimizing from Eq. 6 using Monte Carlo gradient estimation. The adversarial peak is then computed for each example. The global adversarial peak (GAP) is aggregated over all labels. After calculating the GAP value for each class , following previous work (Wang et al., 2019; Dong et al., 2021), we implement Median Absolute Deviation (MAD) to detect the outliers among . Specifically, we use MAD to calculate the anomalous index for each by assuming fits Gaussian distribution. The outlier is then detected by thresholding the anomaly index.
4 Experiments
4.1 Settings
Datasets. We evaluate our approach on CIFAR-10, CIFAR-100, and Tiny-ImageNet datasets. For each task, We build 240 infected and 240 benign models with different architectures: ResNets (He et al., 2016) and DenseNets (Huang et al., 2017). We randomly select one label for each backdoor-infected model and inject sufficient poisoned samples to ensure the attack success rate . More details can be found in the Appendix.
Attack methods. Four different attack methods are implemented: BadNets (Gu et al., 2019), Watermark attack (Chen et al., 2017), Label-Consistent Attack (Turner et al., 2019) and Invisible Attack (Li et al., 2021a). For BadNets and Watermark, the triggers are squares. The transparency ratio for Watermark attack is 0.1. For label-consistent and invisible attacks, we use the default less-visible triggers. Around poison data is injected in training. Each model is trained for 200 epochs with data augmentation. More details can be found in the Appendix G.
Baseline methods. Since there is no existing black-box hard-label method, we compare our approach with two state-of-art white box backdoor detection methods: Neural Cleanse (NC) (Wang et al., 2019) and DL-TND (Wang et al., 2020)222We implement NC (Wang et al., 2019) and DL-TND (Wang et al., 2020) following https://github.com/bolunwang/backdoor and https://github.com/wangren09/TrojanNetDetector. For each task, we use 200 samples for the gradient estimation, and the batch size for each is set to 40 in Algorithm 1.
Outlier detection. To accurately identify the anomalous among , we assume the scores fit to a normal distribution and apply a constant estimator (1.4826) to normalize the computed anomaly index similar to (Wang et al., 2019). We set the threshold value for our MAD detector, which means we identify the class whose corresponding anomaly index larger than 4 as infected. This value is chosen using a hold-out validation set of infected and benign models.
Evaluation metrics. We follow previous work (Kolouri et al., 2020; Wang et al., 2020; Dong et al., 2021; Guo et al., 2020) on using two common metrics: (a) The Area under Receiver Operating Curve (AUROC) – The Receiver Operating Curve (ROC) shows the trade-off between detection success rate for infected models and detection error rate for benign models across different decision thresholds for anomaly index; (b) Detection Accuracy (ACC) – The proportion of models are correctly identified. Regarding infected models, they are correctly identified if and only if the infected labels are identified without mistagging other uninfected labels.

| Task |
|
||||||
|---|---|---|---|---|---|---|---|
| BadNets | Watermark | Label Consistent | Invisible Attack | Total(Infected) | Benign | ||
| CIFAR-10 | |||||||
| CIFAR-100 | |||||||
| TinyImageNet | |||||||


4.2 Results
We first investigate whether AEVA can reveal the singularity phenomenon of labels infected with different attack approaches. We randomly select an infected model infected by each attack approach and an uninfected model for TinyImageNet task. Notably, all these selected models are correctly identified by our approach. We plot the corresponding normalized adversarial perturbation in Fig. 6, which demonstrates that AEVA can accurately and distinguish the uninfected and infected labels and reveal the singularity phenomena of backdoor triggers.
Table 1 presents the overall results. AEVA can accurately detect the infected label with ACC across all three tasks and various trigger settings. We compare our approach with existing white-box detection approaches including Neural Cleanse (NC) (Wang et al., 2019) and DL-TND (Wang et al., 2020). The comparison results over all infected and benign models are shown in Fig. 7. More results can be found in Appendix J. The results suggest that AEVA achieves comparable performance with existing white-box detection approaches across different settings. Such close performance also indicates the efficacy of AEVA on black-box hard-label backdoor detection.
4.3 Ablation Study

The impact of trigger size. We test AEVA on TinyImageNet with different trigger sizes for BadNets and Watermark attacks. For each trigger size and attack method, we build 60 infected models with various architectures following the configurations in Sec. 4.2. Fig. 8 shows that AEVA remains effective when trigger size is less than with ACC . For large triggers, AEVA cannot identify the infected label since the singularity property is alleviated. This is consistent with our theoretical analysis. Even though large trigger attacks can bypass AEVA, they are either visually-distinguishable or leading to a non-robust model sensitive to input change, making it less stealthy and impractical.

The impact of infected label numbers. We further investigate the impact of the number of infected labels. We build 60 infected models for CIFAR-10 to evaluate AEVA. We randomly select infected labels, and we inject a trigger for each infected label. Fig. 9 shows that AEVA performs effectively when the number of infected labels is less than 3 (i.e., of the entire labels) with ACC . It is because too many infected labels fail the MAD outlier detection. Interestingly, existing white-box detection methods (Wang et al., 2019; Chen et al., 2019b; Guo et al., 2020; Liu et al., 2019; Wang et al., 2020) cannot perform effectively in such scenarios either. However, too many infected labels would reduce the stealth of the attacker as well.
Besides these studies, we further evaluate our approach under more scenarios, including the impact of the number of available labels, multiple triggers for a single infected label, different backdoor trigger shapes and potential adaptive backdoor attacks, which are included in the Appendix.
5 Conclusion
This paper takes a first step addressing the black-box hard-label backdoor detection problem. We propose the adversarial extreme value analysis (AEVA) algorithm, which is based on an extreme value analysis on the adversarial map, computed from the monte-carlo gradient estimation due to the black-box hard-label constraint. Extensive experiments demonstrate the efficacy of AEVA across a set of popular tasks and state-of-the-art backdoor attacks.
Ethics Statement
Our work aims at providing neural network practitioners additional protection against backdoor attacks. We believe our work could contribute positively to the human society and avoid potential harm since it addresses a critical safety problem. We are unaware of any direct negative impact out of this work. Our method has certain limitations such as the sensitivity to large backdoor trigger and multiple infected labels. However, as we earlier in the paper, these scenarios make the attack become less stealthy and not practical in real applications.
Reproducibility Statement
Our work is built upon comprehensive theoretical results and clear motivations. We believe the proposed method can be reproduced according to the content in the paper, e.g., Algorithm 1. In addition, we have released the implementation of AEVA in https://github.com/JunfengGo/AEVA-Blackbox-Backdoor-Detection-main.
References
- Chen et al. (2019a) Bryant Chen, Wilka Carvalho, Nathalie Baracaldo, Heiko Ludwig, Benjamin Edwards, Taesung Lee, Ian Molloy, and Biplav Srivastava. Detecting backdoor attacks on deep neural networks by activation clustering. In SafeAI@AAAI, 2019a. URL http://ceur-ws.org/Vol-2301/paper_18.pdf.
- Chen et al. (2019b) Huili Chen, Cheng Fu, Jishen Zhao, and Farinaz Koushanfar. Deepinspect: A black-box trojan detection and mitigation framework for deep neural networks. In IJCAI, pp. 4658–4664, 2019b.
- Chen et al. (2020a) Jianbo Chen, Michael I Jordan, and Martin J Wainwright. Hopskipjumpattack: A query-efficient decision-based attack. In 2020 ieee symposium on security and privacy (sp), pp. 1277–1294. IEEE, 2020a.
- Chen et al. (2020b) Steven Chen, Nicholas Carlini, and David Wagner. Stateful detection of black-box adversarial attacks. In Proceedings of the 1st ACM Workshop on Security and Privacy on Artificial Intelligence, pp. 30–39, 2020b.
- Chen et al. (2017) Xinyun Chen, Chang Liu, Bo Li, Kimberly Lu, and Dawn Song. Targeted backdoor attacks on deep learning systems using data poisoning. CoRR, abs/1712.05526, 2017. URL http://arxiv.org/abs/1712.05526.
- Chen et al. (2019c) Yao Chen, Jiong He, Xiaofan Zhang, Cong Hao, and Deming Chen. Cloud-dnn: An open framework for mapping dnn models to cloud fpgas. In Proceedings of the 2019 ACM/SIGDA international symposium on field-programmable gate arrays, pp. 73–82, 2019c.
- Cheng et al. (2020) Minhao Cheng, Simranjit Singh, Patrick H. Chen, Pin-Yu Chen, Sijia Liu, and Cho-Jui Hsieh. Sign-opt: A query-efficient hard-label adversarial attack. In International Conference on Learning Representations, 2020. URL https://openreview.net/forum?id=SklTQCNtvS.
- Dong et al. (2021) Yinpeng Dong, Xiao Yang, Zhijie Deng, Tianyu Pang, Zihao Xiao, Hang Su, and Jun Zhu. Black-box detection of backdoor attacks with limited information and data. In Proceedings of the IEEE/CVF International Conference on Computer Vision (ICCV), pp. 16482–16491, October 2021.
- Donoho (2006) D.L. Donoho. Compressed sensing. IEEE Transactions on Information Theory, 52(4):1289–1306, 2006. doi: 10.1109/TIT.2006.871582.
- Fowers et al. (2018) Jeremy Fowers, Kalin Ovtcharov, Michael Papamichael, Todd Massengill, Ming Liu, Daniel Lo, Shlomi Alkalay, Michael Haselman, Logan Adams, Mahdi Ghandi, et al. A configurable cloud-scale dnn processor for real-time ai. In 2018 ACM/IEEE 45th Annual International Symposium on Computer Architecture (ISCA), pp. 1–14. IEEE, 2018.
- Fu & Hu (2012) Michael C Fu and Jian-Qiang Hu. Conditional Monte Carlo: Gradient estimation and optimization applications, volume 392. Springer Science & Business Media, 2012.
- Gomes & Guillou (2015) M Ivette Gomes and Armelle Guillou. Extreme value theory and statistics of univariate extremes: a review. International statistical review, 83(2):263–292, 2015.
- Goodfellow et al. (2014) Ian Goodfellow, Jean Pouget-Abadie, Mehdi Mirza, Bing Xu, David Warde-Farley, Sherjil Ozair, Aaron Courville, and Yoshua Bengio. Generative adversarial nets. In Z. Ghahramani, M. Welling, C. Cortes, N. Lawrence, and K. Q. Weinberger (eds.), Advances in Neural Information Processing Systems, volume 27. Curran Associates, Inc., 2014. URL https://proceedings.neurips.cc/paper/2014/file/5ca3e9b122f61f8f06494c97b1afccf3-Paper.pdf.
- Gu et al. (2019) Tianyu Gu, Kang Liu, Brendan Dolan-Gavitt, and Siddharth Garg. Badnets: Evaluating backdooring attacks on deep neural networks. IEEE Access, pp. 47230–47244, 2019. doi: 10.1109/ACCESS.2019.2909068.
- Guo et al. (2020) Wenbo Guo, Lun Wang, Yan Xu, Xinyu Xing, Min Du, and Dawn Song. Towards inspecting and eliminating trojan backdoors in deep neural networks. In 2020 IEEE International Conference on Data Mining (ICDM), pp. 162–171, 2020. doi: 10.1109/ICDM50108.2020.00025.
- He et al. (2016) Kaiming He, Xiangyu Zhang, Shaoqing Ren, and Jian Sun. Deep residual learning for image recognition. In Proceedings of the IEEE conference on computer vision and pattern recognition, pp. 770–778, 2016.
- Huang et al. (2017) Gao Huang, Zhuang Liu, Laurens Van Der Maaten, and Kilian Q Weinberger. Densely connected convolutional networks. In Proceedings of the IEEE conference on computer vision and pattern recognition, pp. 4700–4708, 2017.
- Huang et al. (2022) Kunzhe Huang, Yiming Li, Baoyuan Wu, Zhan Qin, and Kui Ren. Backdoor defense via decoupling the training process. In ICLR, 2022.
- Jacot et al. (2018) Arthur Jacot, Franck Gabriel, and Clement Hongler. Neural tangent kernel: Convergence and generalization in neural networks. In S. Bengio, H. Wallach, H. Larochelle, K. Grauman, N. Cesa-Bianchi, and R. Garnett (eds.), Advances in Neural Information Processing Systems, volume 31. Curran Associates, Inc., 2018. URL https://proceedings.neurips.cc/paper/2018/file/5a4be1fa34e62bb8a6ec6b91d2462f5a-Paper.pdf.
- Ji et al. (2018) Yujie Ji, Xinyang Zhang, Shouling Ji, Xiapu Luo, and Ting Wang. Model-reuse attacks on deep learning systems. In Proceedings of the 2018 ACM SIGSAC Conference on Computer and Communications Security, pp. 349–363, 2018.
- Kolouri et al. (2020) Soheil Kolouri, Aniruddha Saha, Hamed Pirsiavash, and Heiko Hoffmann. Universal litmus patterns: Revealing backdoor attacks in cnns. In Proceedings of the IEEE/CVF Conference on Computer Vision and Pattern Recognition, pp. 301–310, 2020.
- Leadbetter (1991) M.R. Leadbetter. On a basis for peaks over threshold modeling. Statistics and Probability Letters, 12(4):357–362, 1991. ISSN 0167-7152. doi: https://doi.org/10.1016/0167-7152(91)90107-3. URL https://www.sciencedirect.com/science/article/pii/0167715291901073.
- Li et al. (2020) Huichen Li, Xiaojun Xu, Xiaolu Zhang, Shuang Yang, and Bo Li. Qeba: Query-efficient boundary-based blackbox attack. In Proceedings of the IEEE/CVF Conference on Computer Vision and Pattern Recognition (CVPR), June 2020.
- Li et al. (2021a) Shaofeng Li, Minhui Xue, Benjamin Zi Hao Zhao, Haojin Zhu, and Xinpeng Zhang. Invisible backdoor attacks on deep neural networks via steganography and regularization. IEEE Transactions on Dependable and Secure Computing, 18(5):2088–2105, 2021a. doi: 10.1109/TDSC.2020.3021407.
- Li et al. (2022) Yiming Li, Haoxiang Zhong, Xingjun Ma, Yong Jiang, and Shu-Tao Xia. Few-shot backdoor attacks on visual object tracking. In ICLR, 2022.
- Li et al. (2021b) Yuezun Li, Yiming Li, Baoyuan Wu, Longkang Li, Ran He, and Siwei Lyu. Invisible backdoor attack with sample-specific triggers. In ICCV, 2021b.
- Liu et al. (2018) Yingqi Liu, Shiqing Ma, Yousra Aafer, Wen-Chuan Lee, Juan Zhai, Weihang Wang, and Xiangyu Zhang. Trojaning attack on neural networks. In 25nd Annual Network and Distributed System Security Symposium, NDSS 2018, San Diego, California, USA, February 18-221, 2018. The Internet Society, 2018.
- Liu et al. (2019) Yingqi Liu, Wen-Chuan Lee, Guanhong Tao, Shiqing Ma, Yousra Aafer, and Xiangyu Zhang. Abs: Scanning neural networks for back-doors by artificial brain stimulation. In Proceedings of the 2019 ACM SIGSAC Conference on Computer and Communications Security, pp. 1265–1282, 2019.
- Liu et al. (2020) Yunfei Liu, Xingjun Ma, James Bailey, and Feng Lu. Reflection backdoor: A natural backdoor attack on deep neural networks. In European Conference on Computer Vision, pp. 182–199. Springer, 2020.
- Masi et al. (2018) Iacopo Masi, Yue Wu, Tal Hassner, and Prem Natarajan. Deep face recognition: A survey. In 2018 31st SIBGRAPI conference on graphics, patterns and images (SIBGRAPI), pp. 471–478. IEEE, 2018.
- Okuyama et al. (2018) Takafumi Okuyama, Tad Gonsalves, and Jaychand Upadhay. Autonomous driving system based on deep q learnig. In 2018 International Conference on Intelligent Autonomous Systems (ICoIAS), pp. 201–205. IEEE, 2018.
- Ramirez et al. (2013) Carlos Ramirez, Vladik Kreinovich, and Miguel Argaez. Why l1 is a good approximation to l0: A geometric explanation. 7:203–207, 01 2013.
- Saha et al. (2020) Aniruddha Saha, Akshayvarun Subramanya, and Hamed Pirsiavash. Hidden trigger backdoor attacks. In Proceedings of the AAAI Conference on Artificial Intelligence, volume 34, pp. 11957–11965, 2020.
- Singh et al. (2020) Shrutika Singh, Harshita Arya, and P Arun Kumar. Voice assistant for ubuntu implementation using deep neural network. In Advanced Computing Technologies and Applications, pp. 11–20. Springer, 2020.
- Szegedy et al. (2013) Christian Szegedy, Alexander Toshev, and Dumitru Erhan. Deep neural networks for object detection. 2013.
- Tran et al. (2018) Brandon Tran, Jerry Li, and Aleksander Madry. Spectral signatures in backdoor attacks. In S. Bengio, H. Wallach, H. Larochelle, K. Grauman, N. Cesa-Bianchi, and R. Garnett (eds.), Advances in Neural Information Processing Systems, volume 31. Curran Associates, Inc., 2018. URL https://proceedings.neurips.cc/paper/2018/file/280cf18baf4311c92aa5a042336587d3-Paper.pdf.
- Turner et al. (2019) Alexander Turner, Dimitris Tsipras, and Aleksander Madry. Label-consistent backdoor attacks. arXiv preprint arXiv:1912.02771, 2019.
- Wang et al. (2019) Bolun Wang, Yuanshun Yao, Shawn Shan, Huiying Li, Bimal Viswanath, Haitao Zheng, and Ben Y Zhao. Neural cleanse: Identifying and mitigating backdoor attacks in neural networks. In 2019 IEEE Symposium on Security and Privacy (SP), pp. 707–723. IEEE, 2019.
- Wang et al. (2020) Ren Wang, Gaoyuan Zhang, Sijia Liu, Pin-Yu Chen, Jinjun Xiong, and Meng Wang. Practical detection of trojan neural networks: Data-limited and data-free cases. In Proceedings of the European Conference on Computer Vision (ECCV), 2020.
- Wierstra et al. (2014) Daan Wierstra, Tom Schaul, Tobias Glasmachers, Yi Sun, Jan Peters, and Jürgen Schmidhuber. Natural evolution strategies. The Journal of Machine Learning Research, 15(1):949–980, 2014.
- Yao et al. (2019) Yuanshun Yao, Huiying Li, Haitao Zheng, and Ben Y. Zhao. Latent backdoor attacks on deep neural networks. In Proceedings of the 2019 ACM SIGSAC Conference on Computer and Communications Security, CCS ’19, pp. 2041–2055, New York, NY, USA, 2019. Association for Computing Machinery. ISBN 9781450367479. doi: 10.1145/3319535.3354209. URL https://doi.org/10.1145/3319535.3354209.
- Zhai et al. (2021) Tongqing Zhai, Yiming Li, Ziqi Zhang, Baoyuan Wu, Yong Jiang, and Shu-Tao Xia. Backdoor attack against speaker verification. In ICASSP, 2021.
Part
Appendix
Part
Appendix A Other Backdoor Attacks
A.1 Dense Watermark Backdoor Attacks.
In short, we argue that low-magnitude dense backdoor attack(watermark) is not a practical attack method and is less concerned compared to the threat model in our paper.
First, the low-magnitude attack is a special case of our formulation where the mask m is a continuous value (here we use to represent transparency). The low-magnitude problem can be formulated as:
This formulation does not have discrete variables so its black-box optimization is an easier task compared to our problem (where m is discrete).
Second, we will show theoretically that, in this scenario, every normal example is near the decision boundary of the network, because due to Taylor expansion and the fact that a is a small value,
We know from to , the function output label is changed. So every example is at the decision boundary of the function .
So the infected model is actually very sensitive to random noise and becomes ineffective in attacking purposes.
To empirically support this claim, we conduct experiments on CIFAR-10 using ResNet-44. The results are reported over average among ten different target labels. We select watermark triggers randomly which occupy the entire image with 0.1 transparency rate (a). We here add noise which fits uniform distribution with a low magnitude as 0.025 to each normal sample. The proportion of normal samples misclassified by the infected label is shown below. We find that such dense low-magnitude watermark triggers would make normal samples to be misclassified as the target label via adding small random noise. Such observations can easily identify models infected with a dense and low-magnitude watermark trigger.
-
•
Using a global watermark trigger, of the normal samples are misclassified to other labels(Infected label)
-
•
Using a 16x16 watermark trigger, of the normal samples are misclassified to other labels(Infected label)
-
•
Using a 4x4 watermark trigger leads to of the normal samples misclassified
-
•
Using a 2x2 watermark trigger leads to of the normal samples misclassified
-
•
Training with normal examples results in of the normal samples misclassified.
A.2 Feature Space Backdoor
Feature space backdoor attack which employs a generative model to transfer the style of a normal image into a trigger. However, the style transfer leads to significant visual changes which becomes less stealthy. For physical attacks like surveillance cameras, this approach is hard to implement because it requires changing the background as well. While our work is mostly focused on the input space trigger, we believe the latent space problem is beyond our threat model as well as focused problem and could be an interesting future work (for example, consider using an off-the-shelf style transfer model to evaluate the model’s sensitivity towards different style effects.
Appendix B Proofs
B.1 The proof of Lemma 1
Lemma 1.
Given a continuous differential function defined on and vectors , there exists a real value such that
| (8) |
Proof of Lemma 1:
The first order Taylor expansion gives
| (9) |
where is the Lagrange remainder, i.e.,
| (10) |
Let , we have
| (11) |
So, we have
| (12) |
B.2 The proof of Lemma 2 – a theory on the linear case
We perform a theoretical study of linear models to shed light about our empirical finding. Here, we restate Lemma 3 below for convenience.
Lemma 2.
Given a linear model parameterized by optimized on original training examples and backdoored training examples with an objective in Eq. 2 and a mean-squared-error loss, the adversarial solution optimized using Eq. 6 will be dominated by input dimensions corresponding to backdoor mask when is large, i.e.,
| (13) |
Proof of Lemma 2:
To ease the reading of notations, we use to represent matrix with rows and columns, respectively. Assuming is a linear model whose output is a floating number, and the loss function is , i.e., . Then Eq. 2 becomes a linear regression problem and can be represented in the matrix form of least square, i.e.,
| (14) |
where is an backdoor example converted from a normal example and . is the matrix composed of row vectors and is the matrix composed of row vectors . The solution of this least square can be found by setting gradient to zero, such that
| (15) |
It is known that a normal training without backdoors will lead to the pseudo-inverse solution . Without loss of generality, we assume the backdoor trigger occupies the last dimensions. And the first dimensions are normal values, i.e., where is the total number of dimensions. So, we can rewrite the input and the mask . Let be the sub-vector of such that , a dimensional row vector. Then we have where is the total number of backdoor examples. Then,
| (16) |
Similarly, we find and assume zero mean of the input, i.e., , then we have
| (17) |
While becomes larger, both and increase significantly. When , Eq. 15 becomes
| (18) |
In another word, we know the normalized values in the non-masked area of approach 0 such that
| (19) |
Now, let us look at the adversarial objective in Eq. 8, which is equivalent to
| (20) |
the gradient of which is
| (21) |
Since is a scalar and each of the gradient updates is conducted by , we know no matter how many gradient update steps are applied, , initialized at 0, always moves in the exact same direction of , i.e., . In this case, will also be dominant by the last dimensions, or the dimensions corresponded to the mask . In another word, we have
| (22) |
B.3 Proof of Lemma 3 – An analysis for Kernel Regression
Lemma 3.
Suppose the training dataset consists of original examples and backdoor examples, i.i.d. sampled from uniform distribution and belonging to classes. Each class contains equally normal examples. Let be a multivariate kernel regression with the objective in Eq. 2, an RBF kernel Then the adversarial solution to Eq. 6 under cross-entropy loss ( is the one-hot label vector) should satisfy that
| (23) |
Proof of Lemma 3:
The output of is a dimensional vector. Let us assume be the output corresponding to the target class . We know the kernel regression solution is
| (24) |
where is the backdoored example and is the corresponding one-hot label (so we always have ). Because the examples are evenly distributed, there are examples labeled positive for class . Without loss of generality, we assume when and otherwise. Then the regression solution becomes
| (25) |
Please note the regression above is derived with a mean squared loss. In the adversarial analysis Eq. 6, we can use any alternative loss function. In this Lemma, we assume the loss in the adversarial analysis is cross-entropy, which is a common choice. So, we have
| (26) | ||||
| (27) |
where and and .
The derivative of loss w.r.t. becomes
| (28) |
By using gradient descent, moves along the negative direction of the loss gradient, i.e.,
| (29) | ||||
| (30) | ||||
| (31) |
where are both positive scalar values. When becomes large, the first term dominates the gradient direction, i.e., .
Since we assume the kernel is RBF, then we have its derivative
| (32) |
Then we have
| (33) | ||||
| (34) |
Without loss of generality, we assume the mask (where first dimensions are 0s and the remaining are 1s). Then the first dimensions of are the same as those of , while the remaining dimensions equivalent to those of .
Case 1: .
The -th dimension of can be written as
| (35) |
So at convergence, for the last dimensions. The expectation is .
Case 2: .
For the first dimensions, we have
| (36) | ||||
| (37) |
Since for , then we have
| (38) |
Since is large and is i.i.d., then the summation can be approximated with integration, i.e.,
| (39) |
When is large, the integration is the expectation of the offset to the center of a Gaussian distribution (centered at ). Due to symmetry, the derivative becomes 0 for most of the locations. This would be the common cases because a smaller means examples with longer distance can more significantly influence the function output (which is not desired in a classifier with high accuracy).
Nonetheless, in rare cases when the becomes small, we can still find the stationary point of the derivative. Given the fact that is always positive, we know . But it is impossible to reach. Again, utilizing symmetry of the normal distribution and the fact that is i.i.d. uniform, we find when , the derivative is positive; and when , the derivative is negative. Since we use gradient descent to find the optimal . We can conclude that, at the convergence, . Then because is sampled from the same distribution of .
To summarize,
| (40) |
Then we know, as ,
| (41) |
Appendix C Monte Carlos gradient estimation
Leveraging the Monte Carlo based estimation to craft target adversarial perturbations for the targeted label typically requires and , where is a legitimate sample satisfies . Firstly, is forced to approach the decision boundary of for the target label (), which stimulates the efficiency and accuracy of gradient estimation. We can make through projection process:
| (42) |
is a parameters for projection. During each gradient estimation procedure, is set through binary search (Chen et al., 2020a).
After that, we leverage Monte Carlo sampling to estimate , its procedure can be expressed as:
| (43) |
where are perturbations i.i.d sampled from uniform distribution and is a small positive value representing the magnitude of perturbation. is an indicator function such that
| (44) |
To further eliminate the variance induced by Monte Carlo sampling, we can improve via:
| (45) |
Using cosine angle to measure the similarity between and , previous work (Chen et al., 2020a) have proved that:
| (46) |
thus a smaller (0.01) is selected for ensuring the efficacy of gradient estimation.
Regarding the constraints on , we further processed the estimated gradient via:
| (47) |
We refer readers to (Chen et al., 2020a) for the complete algorithm for gradient estimation.
Appendix D Algorithm for Computing Aggregated Global Adversarial Peak (GAP)
Appendix E The detailed configurations for experimental datasets and triggers
| Task | # labels | Input size | # training images |
|---|---|---|---|
| CIFAR-10 | 10 | 32x32 | 50000 |
| CIFAR-100 | 100 | 32x32 | 50000 |
| TinyImageNet | 200 | 64x64 | 1000000 |
The detailed information for each task is included in the Table. 2. The data augmentation utilized for building each model is following https://keras.io/zh/examples/cifar10_resnet/.
Appendix F The accuracy and attack success rate(ASR) for evaluated models
The accuracy and ASR for the evaluated models for each task in included in Table. 3.
| Task | Infected Model | Normal Model Accuracy | |
|---|---|---|---|
| Accuracy | ASR | ||
| CIFAR-10 | |||
| CIFAR-100 | |||
| TinyImageNet | |||
Appendix G The amounts of evaluated models for various task and attack approaches
For each attack and task, we build 60 infected models and 60 uninfected models, respectively. Notably, the uninfected models for different attack approaches are randomly selected and different. Each uninfected and infected model sets are built evenly upon ResNet-18, ResNet-44, ResNet-56, DenseNet-33, DenseNet-58 these five models.
Appendix H Details of visualization process
Appendix I Detailed ROC for varous tasks and attack approaches


Appendix J The comparison results between AEVA and NC, DL-TND
| Attack | Method | Detection Results | |||||||||||
|---|---|---|---|---|---|---|---|---|---|---|---|---|---|
| AUROC | ACC | ||||||||||||
|
|
|
|
||||||||||
|
|
|
|
||||||||||
|
|
|
|
||||||||||
|
|
|
|
||||||||||
| Attack | Method | Detection Results | |||||||||||
|---|---|---|---|---|---|---|---|---|---|---|---|---|---|
| AUROC | ACC | ||||||||||||
|
|
|
|
||||||||||
|
|
|
|
||||||||||
|
|
|
|
||||||||||
|
|
|
|
||||||||||
| Attack | Method | Detection Results | |||||||||||
|---|---|---|---|---|---|---|---|---|---|---|---|---|---|
| AUROC | ACC | ||||||||||||
|
|
|
|
||||||||||
|
|
|
|
||||||||||
|
|
|
|
||||||||||
|
|
|
|
||||||||||
Appendix K Experiments for different triggers
K.1 Evaluation on dynamic and sparse but not compact triggers
We evaluate AEVA for CIFAR-10 task under the dynamic and non-compact triggers scenario. We randomly generate three non-compact triggers(shown in Figure. 11) and perform backdoor attacks against a randomly selected label using these dynamic triggers. We test AEVA using 10 different DNN models, which are evenly built upon ResNet-18, ResNet-44, ResNet-56, DenseNet-33 and DenseNet-58.


AEVA successfully identify all models embedded with dynamic backdoors and the corresponding infected labels. The detailed Aggregated Global Adversarial Peak(AGAP) values and Anomaly Index given by the MAD outlier detection for infected and uninfected labels are shown in Fig. 12. We find AEVA predicts all backdoored models as infected with Anomaly Index . Such results demonstrate that AEVA is resilient to dynamic and sparse but not compact triggers.


We also evaluate AEVA on three different triggers with different shapes, which are shown in Fig. 13. For each trigger, we build 30 models on TinyImageNet. Each set of models are evenly built upon ResNet-18, ResNet-44, ResNet-56, DenseNet-33, DenseNet-58 these architectures. The results are shown in Table. 7.
| Attack Approach | ACC |
|---|---|
| Trigger I | |
| Trigger II | |
| Trigger III |


Appendix L Results for impact of the number of images per labels.
We further explore how many samples for each label are required by AEVA to be effective. We test AEVA on TinyImageNet and the experimental configurations are consistent with Sec.4.1(i.e., 240 infected and 240 benign models). Our results are illustrated in the Fig. 14, which plots the metrics against the number of samples per class. We find that our approach requires more samples (32) for each class to achieve optimal performance.

Appendix M The impact of the number of the labels for available images.
Since our approach aims to detect backdoors in the black-box setting, a realistic scenario is that while determining if a specific label is infected, the clean data from all other labels may be unavailable to the defender. So, in this section, we investigate the impact of the number of labels for which clean data is available for our approach. We test our approach on TinyImageNet using 60 models infected with BadNets ( squares) following the configurations of Sec. 4.2. We vary the number of uninfected labels for available samples between [1, 200], randomly sampled from the 200 labels available in the TingImageNet dataset. Figure. 15 illustrates our results by plotting the metrics against the number of available labels. We observe that even with eight available labels, our approach can still detect backdoors in most cases, i.e., with merely of the labels being available, our approach is still viable. This study exhibits our approach’s practicality, which can work in the black-box setting and on relatively small available data. Notably, with fewer labels AEVA will always correctly tag the uninfected models. This is because few labels will cause the anomaly index low thus resilient to uninfected models.

Appendix N Multiple triggers within the single infected label scenarios
We also investigate the impact caused by multiple triggers within the single infected label. We here choose different squares located at different places as the triggers implemented following BadNets. We randomly select a label as the infected label. We built 60 infected models with different architectures(i.e., ResNet-18, ResNet-44, ResNet-56, DenseNet-33, DenseNet-58). The results for TinyImageNet are shown in Table. 8. Notably, for TinyImageNet, injecting too many triggers () in the single label would cause the target model’s accuracy drop (i.e., ), which is inconsistent with the threat model for backdoor attacks (Gu et al., 2019; Chen et al., 2017; Liu et al., 2018).
As seen in Table. 8, our approach can still perform effective when injecting two triggers in the single infected label. However, when the number of injected triggers becomes more than 2, our approach becomes less effective. This should be caused by that multiple-triggers would reduce the singularity properties for the adversarial perturbations. To address this issue, we select the sum of the largest five points as the instead. The results are shown in Table. 9. By selecting more points to calculate the , AEVA can still perform effective under the multiple triggers within the single label scenarios and have no impact on the detection accuracy for uninfected models.
| Attack Approach | ACC |
|---|---|
| Two infected triggers | |
| Three infected triggers |
| Attack Approach | ACC |
|---|---|
| Two infected triggers | |
| Three infected triggers |
Appendix O Potential adaptive backdoor attacks
We here consider two potential backdoor attacks which can bypass AEVA.
O.1 Attacks with multiple target labels
Since AEVA is sensitive to the number of infected labels, the attacker can infect multiple labels with different backdoor triggers. Indeed, making multiple labels (i.e.;) infected will make the anomaly indexes produced by the MAD detector significantly drop. However, such attack can only be successfully implemented for some small datasets which own a few labels(e.g., CIFAR-10, etc). Reported by (Wang et al., 2019), the state-of-the-art model (DeepID) for Youtube Face dataset can not maintain the average attack success rate and model accuracy at the same time when more than labels are infected. In another word, when multiple labels are infected, the infected model’s accuracy is likely to get worse if the attacker wants to keep attack success rate. So too many infected labels will reduce the stealth of the attack. We conducted experiments on TinyImageNet, which reveals that when over 14 labels are infected with different triggers, the model accuracy (ResNet-44 and DenseNet-58) decreases to (around 3% lower than a normal model) when preserving the attack effectiveness (ASR ) for each infected label.
O.2 Attack with large triggers
Another potential adaptive backdoor attack is that the attacker would implement a dense backdoor trigger which would alleviate the singularity phenomenon. As we claim in Section 4.3, a dense backdoor trigger would appear visually-distinguishable to the human beings which perform less stealthy, that is also reported by Neural Cleanse (Wang et al., 2019). Indeed, there exists an interesting exceptional watermark attacks. However, we empirically prove that such dense watermark attack (Chen et al., 2017) would make infected DNNs non-robust which would make the inputs sensitive to the random noise. The details are included in Appendix A.