A Subjective Quality Evaluation of 3D Mesh with Dynamic Level of Detail in Virtual Reality
Abstract
3D meshes are one of the main components of Virtual Reality applications. However, a huge amount of network and computational resources are required to process 3D meshes in real-time. A potential solution to this challenge is to dynamically adapt the Level of Detail (LoD) of a 3D mesh based on the object’s position and the user’s viewpoint. In this paper, we conduct a subjective study to investigate users’ quality perception of 3D meshes with dynamic Level of Detail in a Virtual Reality environment. The subjective experiment is carried out with five 3D meshes of different characteristics, four Levels of Detail, and four distance settings. The results of the experiment show that the impact of the dynamic level of detail depends on both the position of the 3D object in the virtual world and the number of vertices of the original mesh. In addition, we present a quality model that can accurately predict the MOS score of a LoD version of a 3D mesh from the number of vertices and the distance from the viewpoint.
Index Terms— Virtual Reality, 3D Mesh, Level of Detail, Quality of Experience (QoE)
1 Introduction
3D models play a central role in constructing a Virtual Reality environment. For instance, 3D models of the museum itself and all artifacts are needed to build a VR-based virtual museum. A 3D model can be represented in several formats, notably polygon mesh and point cloud. A polygon mesh (3D mesh) [1] represents a 3D model by using polygons, usually triangles, that form a network of faces. Each polygon is represented by vertices, edges, and a normal vector that defines its orientation. The surface of the model can be smoothed, textured, or colored by applying different attributes to the polygon and its vertices. A point cloud is a collection of points in space that defines the shape and surface of the 3D model [2]. Each point is attributed by its coordinates, color, and intensity. In this paper, we consider 3D models represented by 3D meshes.
A Virtual Reality environment usually contains a large number of objects. Thus, the system must be able to process a large number of 3D meshes in real time to offer users a high quality of experience. However, 3D mesh processing is a resource-intensive task, requiring a large amount of not only computational resources but also network resources. The computational resource is mainly associated with the rendering of a 3D mesh, which generates a 2D image from the 3D mesh given the user’s viewpoint. In general, complex 3D meshes demand more computational resources than simpler ones. The network resource is required if the 3D meshes are stored on a remote server as in the case of Web-based Virtual Reality [3]. In this case, the user agent (i.e., the web browser) must download all the 3D meshes stored on the server to the user device. Like the computational resources, complex 3D meshes have large data sizes and thus demand more network resources than simple 3D meshes.
Dynamic Level of Detail (LoD) is a potential method to optimize the transmission and processing of 3D meshes on resource-constrained devices. In particular, multiple versions of different levels of detail are generated from the original mesh in advance. The system then decides an appropriate LoD version for each 3D mesh based on the object’s position and the user’s viewpoint [3]. In general, high LoD versions are chosen for those models that are close to the viewer. On the other hand, versions with low LoD are selected for 3D meshes that are far away.
There are two key questions in dynamic Level of Detail-based VR systems, which are:
-
1.
How to generate LoD versions of a 3D mesh?
-
2.
How to select the appropriate LoD version of a 3D mesh given the system constraints?
So far, existing works mainly focus on answering the second question by proposing various LoD version selection algorithms [4, 5, 3]. To answer the first question, it is critical to understand the user’s perception of a LoD version in a Virtual Reality environment. A LoD version of a 3D mesh can be generated by several methods such as downsampling, geometric simplification, and compression. In this paper, we consider geometric simplification as the LoD version generation method and leave the other methods for our future work. Our investigation shows that the effects of geometry simplification are largely dependent on the number of vertices of the original meshes. In particular, for 3D meshes with 100K+ vertices, it is possible to remove up to 95% of the vertices without significant loss in user-perceived quality. Based on the subjective experiment results, we present a non-reference quality model for predicting the MOS score of a LoD version based on the distance from the viewer and the number of vertices of the LoD version.
The rest of this paper is organized as follows. Section 2 gives an overview of the related work. Section 3 describes our experiment settings. Section 4 presents the result analysis. Section 5 describes the quality model for predicting MOS score of a given LoD version. Finally, Section 6 concludes this paper.
2 Related work
In the literature, dynamic Level of Details has been applied to optimize the transmission and rendering of 3D mesh [4, 6, 7]. In particular, multiple versions with different Levels of Details of the original 3D mesh are generated using techniques such as downsampling [3], edge collapse [8], and compression [9, 6]. Then, the suitable LoD version for each 3D mesh is chosen to maximize the user quality of experience given the constraints on network and processing resources. For LoD version selection, previous works rely on objective quality metrics such as screen-space error [4, 7], and projected screen area [3, 6] to decide the importance of each 3D mesh as well as the overall quality of all 3D meshes presented in the scene, then ranking-based algorithm [9] or dynamic programming-based algorithms [7, 6] are applied to find the appropriate LoD version for each 3D mesh.
The user’s quality perception of a 3D mesh is affected by various factors including content-related factors, environment-related factors, and processing-related factors. Previous works have studied the impacts of content-related factors such as content characteristics [10], and diffuse colors [11]. The impacts of processing-related factors such as distortion types [12, 13], and deformation interaction [10] have also been investigated. Previous works have also investigated the influence of environment-related factors such as lighting condition [14], and light-material interaction [15]. The impact of the distance from the viewpoint is first studied in our previous work [16]. However, the subjective experiment in [16] is carried out in a non-virtual reality environment, and thus the findings in that work can not be applied to Virtual Reality.

Squirrel

Hulk

Statue

Car

Dwarf
| LoD Version | Squirrel | Hulk | Statue | Car | Dwarf |
|---|---|---|---|---|---|
| Version 1 | 3099 (581KB) | 5257 (953KB) | 52002 (10822KB) | 62060 (12137KB) | 125004(26587KB) |
| Version 2 | 1865 (345KB) | 3241 (577KB) | 31195 (6452KB) | 37665(7290KB) | 75004(15659KB) |
| Version 3 | 629 (111KB) | 1187 (195KB) | 10389 (2076KB) | 13087(2441KB) | 25004(5235KB) |
| Version 4 | 318 (56KB) | 668 (99KB) | 5187 (1017KB) | 6890(1235KB) | 12504(2601KB) |
3 Subjective Quality Experiment
3.1 Experiment Conditions
In this study, we use five 3D meshes from the public dataset constructed in [13]. The snapshots of five 3D meshes are shown in Fig. 6. The Squirrel and Statue models are reconstructed from multiple images of actual objects, so the texture images of these meshes are noisier and contain more complex texture seams. The Dwarf model is a scanned model created from reconstruction and scanning. The Hulk and Car models are artificial models created using modeling software with structured texture content and smooth textured seams. These 3D meshes cover a wide variety of texture and geometry properties. The number of vertices ranges from 6K (Squirrel model) to 250K (Dwarf model).
For the subjective experiment, we apply simplification of geometric data to create LoD versions of the 3D mesh as proposed in [3]. In particular, the 3D meshes are simplified based on iterative edge contraction and quadratic error metrics, which can rapidly produce high-quality approximations of such models. This simplification does not access the pixels of the texture, which merely tries to update the texture coordinates of the texture map so that the texture is mapped onto the surface in the same way as the original model. Four LoD versions are generated for each 3D mesh with the number of vertices that are 50%, 30%, 10%, and 5% of the number of vertices of the original model using the MeshLab software [17]. The number of vertices and the sizes in KBytes of the LoD versions of five 3D meshes are shown in Table 1. It is worth noting that the size of the LoD versions is proportional to the number of vertices. Also, deciding the optimal number of vertices to be retained for each LoD version is an interesting research question and is reserved for our future work.


3.2 Procedure
To carry out the subjective experiment, we develop a test environment using A-Frame [18], which is a Web-based Virtual Reality framework. In the test environment, the position and direction of the viewpoint are fixed while the location of a LoD version of a 3D mesh is varied. In this study, we consider four distances between the viewpoint and the 3D meshes which are meters. As a result, our experiment consists of 80 stimuli.
The LoD versions are in Object file format and are loaded at the beginning of each test session. The stimuli are displayed in random order and participants are asked to give their opinion scores on a 5-grade scale. We utilize the double-stimulus impairment scale (DSIS) approach to determine the subjective score for each stimulus [19]. In this method, the LoD version and the original 3D mesh are displayed side by side with which the LoD version is displayed on the right side of the viewport as shown in Fig. 7a.
To allow the participant to accurately access the visual quality of a 3D mesh, a LoD version and the corresponding original 3D mesh are rotated clockwise three times during the test. The time interval between rotations is set to 4s, so the total time of appearance for a LoD version is approximately 12s. After that, the viewer is asked to rate the quality of the impaired mesh on a 5-grade scale as follows: 5 (imperceptible), 4 (perceptible, but not annoying), 3 (slightly annoying), 2 (annoying), and 1(very annoying). The scores are displayed in the test environment as shown in Fig. 7b. There is no time limit to vote, and the stimuli are not shown during the voting period. The subjective study is conducted in a Virtual Reality setting using an Oculus Quest 2 headset, with a resolution of 1832 × 1920 per eye and a refresh rate of 90 Hz. The participants use controllers to give scores for each stimulus.
A total of 20 participants took part in the subjective experiment, aged between 19 and 32, all with normal or corrected-to-normal vision. At the beginning of each test session, we explain the objectives of the test and the test procedure to the participant. On average, it takes about 30 minutes for each participant to finish the experiment. The Mean Opinion Score (MOS) of a stimulus is calculated as the average score of all participants who have evaluated the stimulus.

| Source of Variation | SS | df | MS | F | P-value | F crit |
|---|---|---|---|---|---|---|
| Between Groups | 36.43269 | 4 | 9.108172 | 23.20878 | 1.66E-12 | 2.493696 |
| Within Groups | 29.43339 | 75 | 0.392445 |


4 Experiment Results and Analysis
In this section, we present and analyze the results of the subjective experiment described in the previous section.
4.1 Statistical Analysis
First, we conduct a statistical analysis of the obtained user ratings. The results of the one-way ANOVA test are shown in Table 2. It can be seen that the p-value is less than 0.05, indicating that there is a statistically significant difference in the user ratings of the five 3D meshes. We additionally conduct a follow-up test to investigate the statistical difference between pairs of 3D meshes. The results of the Tukey’s HSD Pairwise Group Comparisons test with 95.0% Confidence Interval show that there is a statistically significant difference between Squirrel and Hulk, Squirrel and Statue, Squirrel and Car, Squirrel and Dwarf, Hulk and Statue, and Hulk and Dwarf (). Meanwhile, there is no statistically significant difference in the user ratings between Hulk and Car, Statue and Car, Statue and Dwarf, and Car and Dwarf ().
4.2 Impact of Distance
Next, we analyze the impact of the distance on the MOS scores of the LoD versions of five considered 3D meshes. Fig. 8 shows the boxplot of the user ratings at five considered distances. It can be seen that the mean user rating increases as the distance between the 3D mesh and the viewpoint increases. This result indicates that the further the distance is, the more difficult for the participants to recognize the distortion level of a LoD version. This result can be explained by the fact that the size of a 3D mesh on the viewport becomes smaller as the distance increases.
Fig. 9 shows the MOSs of the LoD versions of the five 3D meshes at four distance values with 95% confident interval. It can be seen that the impact of the distance varies significantly across LoD versions and 3D meshes. Table 3 shows the increases in MOS score as the distance increases from to of the LoD versions of the five 3D meshes. For the Squirrel model, the MOS values of the LoD versions increase by 0.350.8 as the distance increases from to . Among the LoD versions, Version 4 has the smallest amount of increase while Version 3 has the biggest. The MOS scores of Version 4 of Hulk and Statue models are increased significantly by more than 1 MOS. For the Statue, Car, and Dwarf models, LoD versions with a smaller number of vertices have a bigger amount of increase in MOS score than those with less number of vertices. It can be also seen that the differences in the amount of increase in MOS between the LoD versions are relatively small for the Car and Dwarf models. Especially, the difference between Version 1 and Version 4 is less than 0.1 MOS.
| LoD Version | Squirel | Hulk | Statue | Car | Dwarf |
|---|---|---|---|---|---|
| Version 1 | 0.75 | 0.5 | 0.3 | 0.42 | 0.23 |
| Version 2 | 0.6 | 0.3 | 0.5 | 0.42 | 0.27 |
| Version 3 | 0.8 | 0.8 | 0.9 | 0.54 | 0.27 |
| Version 4 | 0.35 | 1.15 | 1.1 | 0.69 | 0.31 |


4.3 Impact of LoD version
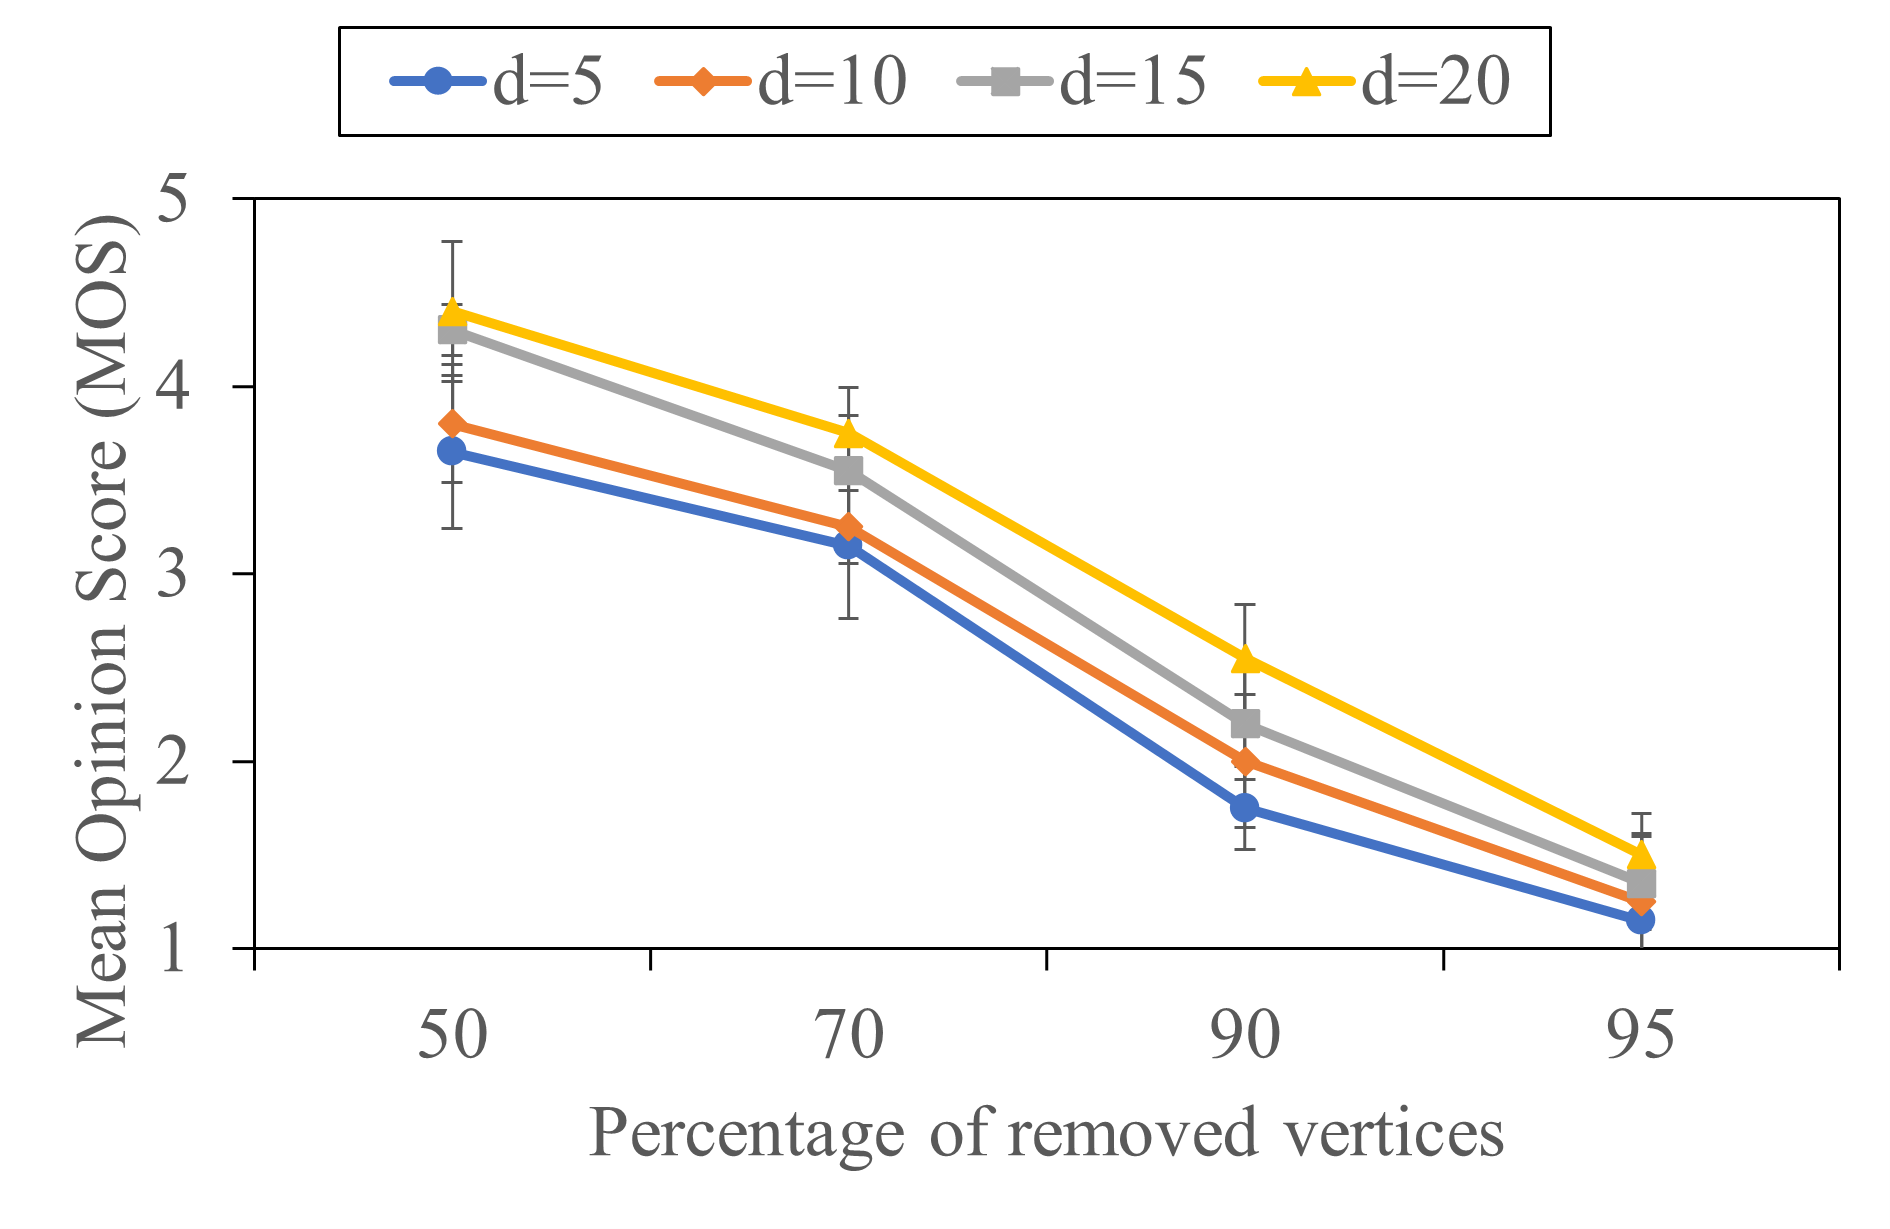
In this part, we analyze the impact of LoD version on the user ratings. Fig. 10 shows the mean user rating of different LoD versions of the five 3D meshes. Here, a LoD version is represented by the percentage of removed vertices. It can be seen that the impact of geometry downsampling varies across the considered meshes. For the Squirrel and the Hulk meshes, the MOS score decreases significantly as the percentage of removed vertices increases across all distance settings. The user rating of the Squirrel and Hulk models drops by MOS and MOS, respectively. It can also be noted that the downtrend of the user rating is quite consistent at all distance settings. For the Statue mesh, the reduction in MOS score is significant only at the smallest distance of . At higher distance settings, the difference between the MOS scores of Version 1 (removed 50%) and Version 4 (removed 95%) is less than 0.35. In addition, the MOS scores of Version 4 at distances farther than 5 are higher than 4 MOS. In the case of the Car and Dwarf meshes, it can be seen that the MOS score decreases very slightly as the percentage of the removed vertices increases. Especially, the difference in MOS core between Version 1 and Version 4 of the Dwarf model is less than 0.3.


4.4 Impact of Content Charatertistics
In this part, we analyze the impact of mesh characteristics on the user rating. Figure 11a plots the average decrease in MOS (Version 4 vs. Version 1) against the number of vertices of the original meshes. It can be seen that the impact of geometry downsampling on the MOS score has a strong correlation with the number of vertices of the meshes. In particular, the smaller the number of vertices of the original model is, the bigger the reduction level in the MOS score becomes. For those meshes with the number of vertices higher than 100K, the difference in the MOS scores between the LoD versions is relatively small. Figure 11b shows the relationship between the average MOS score and the number of vertices of the original mesh. It can be seen that the mesh with a higher number of vertices tends to have a higher average MOS. Especially, the average MOS score of the Statue, Car, and Dwarf meshes is higher than four.
| Mesh | |||||
|---|---|---|---|---|---|
| Squirrel | 1.2818 | 2.2571 | -0.2534 | -6.3880 | 0.99 |
| Hulk | 1.0466 | -0.3993 | 0.1123 | -6.26746 | 0.99 |
| Statue | 0.7676 | 2.8189 | -0.2415 | -4.0358 | 0.97 |
| Car | 0.3862 | 1.4810 | -0.1146 | -0.3960 | 0.89 |
| Dwarf | 0.1249 | 0.3506 | -0.0149 | 2.6648 | 0.84 |
| Mesh | PLCC | SROCC | RMSE |
|---|---|---|---|
| Squirrel | 0.99 | 0.99 | 0.08 |
| Hulk | 0.99 | 1.00 | 0.10 |
| Statue | 0.98 | 0.98 | 0.06 |
| Car | 0.94 | 0.98 | 0.07 |
| Dwarf | 0.92 | 0.92 | 0.06 |

5 3D Mesh Quality Model
In this part, we model the subjective scores as a function of the distance from the viewer and the number of vertices of the LoD versions. In particular, we propose to model the MOS scores with the following function.
| (1) |
Here, denotes the value of the vertices of a LoD version to that of the original model. denotes the distance to the viewer. denotes the natural logarithm function. In the proposed model, the first term represents the impact of the number of vertices on perceptual quality. The second term represents the influence of the distance to the viewer. The mutual impact of the distance and the number of vertices is represented by the third term. , and are model parameters. The model parameters are determined by means of linear regression. The values of the parameters and coefficient of determination of the proposed model are shown in Table 4. The scatter diagram of the predicted MOS values and the subjective scores is shown in Fig. 12. It can be seen that the proposed model achieves high values of the coefficient of determination for all three meshes (). The performance of the proposed model in terms of Pearson correlation coefficient (PLCC), Spearman’s rank correlation coefficient (SROCC), and Root mean squared error(RMSE) is shown in Table 5. We can see that the PLCC and SROCC values are higher than 0.98 for all three meshes, while the RMSE values are smaller than 0.10. This result indicates that the proposed model can accurately predict the subjective scores of the LoD versions.
6 Conclusions
In this paper, we have studied the user perception of 3D meshes with dynamic Level of Detail in Virtual Reality. Our study shows that the user perception of the mesh quality is affected by not only the level of detail but also the position of the mesh in the virtual environment. In addition, the impact of geometry downsampling is largely dependent on the number of vertices of the original mesh. For the meshes with 100K+ vertices, it is possible to remove up to 95% number of vertices without significant impact on the user-perceived quality. In future work, we will study the method to generate optimal sets of LoD versions for a given mesh.
References
- [1] “Polygon Mesh,” https://en.wikipedia.org/wiki/Polygon_mesh.
- [2] “Point Cloud,” https://en.wikipedia.org/wiki/Point_cloud.
- [3] Nguyen Long Quang, Truong Thu Huong, Pham Ngoc Nam, Truong Cong Thang, and Duc Nguyen, “Visibility-aware 3d models transmission for virtual reality applications,” IEICE Communications Express, vol. 12, no. 6, pp. 350–355, 2023.
- [4] David Luebke, Martin Reddy, Jonathan D Cohen, Amitabh Varshney, Benjamin Watson, and Robert Huebner, Level of detail for 3D graphics, Morgan Kaufmann, 2003.
- [5] Filip Strugar, “Continuous distance-dependent level of detail for rendering heightmaps,” Journal of Graphics, GPU, and Game Tools, vol. 14, no. 4, pp. 57–74, 2009.
- [6] Nguyen Long Quang, Nguyen Duc, and Truong Thu Huong, “Toward optimal dynamic point cloud streaming over bandwidth-constrained networks,” in Proceedings of the 5thth ACM Conference on Multimedia Asia, Tainan, Taiwan, Dec. 2023.
- [7] Stefano Petrangeli, Gwendal Simon, Haoliang Wang, and Vishy Swaminathan, “Dynamic adaptive streaming for augmented reality applications,” in 2019 IEEE International Symposium on Multimedia (ISM), 2019, pp. 56–567.
- [8] Hugues Hoppe, “Progressive meshes,” in Proceedings of the 23rd annual conference on Computer graphics and interactive techniques, 1996, pp. 99–108.
- [9] Jeroen Van Der Hooft, Tim Wauters, Filip De Turck, Christian Timmerer, and Hermann Hellwagner, “Towards 6dof http adaptive streaming through point cloud compression,” in Proceedings of the 27th ACM International Conference on Multimedia, 2019, pp. 2405–2413.
- [10] Yana Nehmé, Johanna Delanoy, Florent Dupont, Jean-Philippe Farrugia, Patrick Le Callet, and Guillaume Lavoué, “Textured mesh quality assessment: Large-scale dataset and deep learning-based quality metric,” ACM Transactions on Graphics, vol. 42, no. 3, pp. 1–20, 2023.
- [11] Yana Nehmé, Florent Dupont, Jean-Philippe Farrugia, Patrick Le Callet, and Guillaume Lavoué, “Visual quality of 3d meshes with diffuse colors in virtual reality: Subjective and objective evaluation,” IEEE Trans. Vis. & Comp. Graph., vol. 27, no. 3, pp. 2202–2219, 2021.
- [12] Yixin Pan, Irene Cheng, and Anup Basu, “Quality metric for approximating subjective evaluation of 3-d objects,” IEEE Transactions on Multimedia, vol. 7, no. 2, pp. 269–279, 2005.
- [13] Jinjiang Guo, Vincent Vidal, Irene Cheng, Anup Basu, Atilla Baskurt, and Guillaume Lavoue, “Subjective and objective visual quality assessment of textured 3d meshes,” ACM Trans. Appl. Percept., vol. 14, no. 2, oct 2016.
- [14] Jesús Gutiérrez, Toinon Vigier, and Patrick Le Callet, “Quality evaluation of 3d objects in mixed reality for different lighting conditions,” Electronic Imaging, vol. 32, pp. 1–7, 2020.
- [15] Kenneth Vanhoey, Basile Sauvage, Pierre Kraemer, and Guillaume Lavoué, “Visual quality assessment of 3d models: On the influence of light-material interaction,” ACM Transactions on Applied Perception (TAP), vol. 15, no. 1, pp. 1–18, 2017.
- [16] Duc Nguyen, Tran Thuy Hien, Tran Thi Thanh Huyen Tran, Truong Thu Huong, and Pham Ngoc Nam, “An Evaluation of the Impact of Distance on Perceptual Quality of Textured 3D Meshes,” IEICE Transactions on Information and Systems, Special Session on Enriched Media - Media technologies opening up the future -, vol. D-107, no. 1, pp. 1–5, Jan. 2024.
- [17] Paolo Cignoni, Marco Callieri, Massimiliano Corsini, Matteo Dellepiane, Fabio Ganovelli, Guido Ranzuglia, et al., “Meshlab: an open-source mesh processing tool,” in Eurographics Italian chapter conference. Salerno, Italy, 2008, vol. 2008, pp. 129–136.
- [18] Supermedium, “A-frame,” 2015.
- [19] I BT, “Methodologies for the subjective assessment of the quality of television images, document recommendation itu-r bt. 500-14 (10/2019),” ITU, Geneva, Switzerland, 2020.