A Statistical Study of Low-frequency Solar Radio Type-III Bursts
keywords:
Corona, Radio Emission – Radio Bursts, Association with Flares – Radio Bursts, Type III – Radio Emission, Active Regions1 Introduction
Intro
Among various types of solar radio bursts that are classified by Wild (1950), type III bursts are the most intense, fast drifting and frequently observed bursts. These bursts are observed ranging from inner corona to 1 AU and some times even beyond. Type III bursts occur as a isolated bursts (lasts from 1 to 3 s), groups that lasts in 10 minutes, and as a storm which lasts from 10 mins to few tens of hours. Although their emission mechanism is still debated, their occurrence happens in the two steps: (i) during a flare or magnetic re-connection, huge amount of magnetic energy converts into kinetic energy that results in acceleration of particles. Such particles generate plasma oscillation (also known as Langmuir waves) during their passage along open magnetic field lines in the solar corona and interplanetary medium (IPM); (ii) subsequent conversion of these oscillations into electro-magnetic waves at the plasma frequency () called fundamental (F) emission and harmonic (H) emission at (see for example Ginzburg and Zhelezniakov, 1958; Zheleznyakov and Zaitsev, 1970; Melrose, 1980; Ramesh et al., 2003, 2005; Reid and Ratcliffe, 2014; Kishore et al., 2015, 2017). The measured average frequency ratio of harmonic emission to fundamental emission is 1.8 (Stewart, 1974). It was also reported that F emissions are more directive than the H emissions (Suzuki and Sheridan, 1982; Sasikumar Raja and Ramesh, 2013). The electron density () and hence plasma frequency () decreases as we move radially outwords in the solar corona. Therefore, lower the frequency of observations we probe outer layers in the corona and hence, type III bursts drift from higher to lower frequencies.
In this article, we have carried out a statistical study of the 1531 type III bursts that are observed during 2013-2017. For this study, we have used the data obtained using the Compact Astronomical Low-frequency Low-cost Instrument for Spectroscopy in Transportable Observatories (CALLISTO) spectrometer111http://www.e-callisto.org/ (Benz et al., 2009; Monstein, Ramesh, and Kathiravan, 2007; Zucca et al., 2012; Sasikumar Raja et al., 2018) located at Gauribidanur Radio Observatory (GRO; Lat: N and Long: E) which is 100 km north of Bangalore, India (Ramesh, 2011, 2014). An extensive statistical study of the type III bursts has not been done so far because of lack of data sets and due to non-existence of the automated detection algorithms. In this work, we have make use of the catalog provided by Singh et al. (2019) that are detected using an automated algorithm. Earlier studies of type III bursts have been done by Saint-Hilaire, Vilmer, and Kerdraon (2013) using the observations carried out using Nancay Radioheliograph observations (Kerdraon and Delouis, 1997).
2 Observations
Obs
In this study, we have used data observed by the CALLISTO spectrometer that is located at Gauribidanur Radio Observatory (GRO). A single log-periodic dipole antenna that operate over 30 - 1100 MHz (VSWR 2) with a gain of dB was used as a primary receiving element which is then fed to an amplifier of 45 dB at the base of the antenna. The signal brought to the receiver room which is about a 100 meter using coaxial cable and then connected to the receiver developed at ETH Zurich, Switzerland. Although the receiver can operate from 45 - 870 MHz, the CALLISTO spectrometer at GRO is configured to operate between 45 - 410 MHz in order to increase the frequency resolution. The frequency resolution of the spectrometer is 62.5 kHz and the radiometric bandwidth is kHz. The CALLISTO spectrometer was set up in 2009 and since then it has been used to monitor transient emissions from the solar corona during 02:30 - 11:30 UT. The time resolution of the instrument is 0.25s at the rate of 200 channels per spectrum. Note that the time difference between two consecutive spectral pixels is 1.25ms (Benz et al., 2009; Monstein, Ramesh, and
Kathiravan, 2007; Singh et al., 2019).
In this study, we have used the catalog of type III bursts that was identified using automated algorithm by Singh et al. (2019) during 2013 - 2017 (http://www.iiserpune.ac.in/~p.subramanian/Bursts.zip). For example, Figure \ireffig:ds shows the dynamic spectrogram that was observed on September 7, 2017 using the CALLISTO spectrometer located at GRO. Note that median of the every frequency channel measured over a whole day was subtracted from the corresponding channel to get rid of continuous radio frequency interference (RFI). While preparing the catalog, in order to mitigate type III burst-like RFI, Singh et al. (2019) have eliminated the features / RFI with the drifting rates (, where and are bandwidth and duration of the burst/feature in the dynamic spectrogram) that does not fall in the range . This filtering technique successfully eliminates the type III burst-like RFI without eliminating the type III bursts. In addition, we have measured start and end time of the type III burst shown in Figure \ireffig:ds which are 9:52:58 and 9:54:28 UT; and the lower and upper frequency cutoffs of burst are 45 to MHz. Similarly, we have identified 1531 type III bursts and measured these parameters manually. Furthermore, we have studied the flare associated type III bursts by knowing the flare parameters like onset, peak, end times, class of the flare, associated active region, and location of the flare 222https://cdaw.gsfc.nasa.gov/CME_list/NOAA/org˙events˙text/, 333https://www.ngdc.noaa.gov/stp/space-weather/solar-data/solar-features/solar-flares/x-rays/goes/xrs/, 444http://www.lmsal.com/solarsoft/ssw/last˙events-2014/, 555http://hec.helio-vo.eu/hec/hec˙gui.php. For instance the type III bursts shown in Figure \ireffig:ds was triggered by a M1.4 class flare as observed by Geostationary Operational Environmental Satellites (GOES) as seen in Figure \ireffig:goes. The onset and end time of the flare were 09:49 and 09:58 UT with peak emission at 09:54 UT. In the Figure \ireffig:sdo, left panel shows the observations of Atmospheric Imaging Assembly (AIA; Lemen et al., 2012) onboard Solar Dynamics Observatory (SDO; Pesnell, Thompson, and Chamberlin, 2012) at 171 Åwavelength band and the right panel shows the observations of Helioseismic and Magnetic Imager (HMI; Schou et al., 2012) onboard SDO. The red colored boxes in both panels indicate the active region NOAA 12673 that triggered the type III burst (see Figure \ireffig:ds) and the flare (see Figure \ireffig:goes). The location of the flare was at S07oW46o (see Figure \ireffig:sdo).

fig:ds
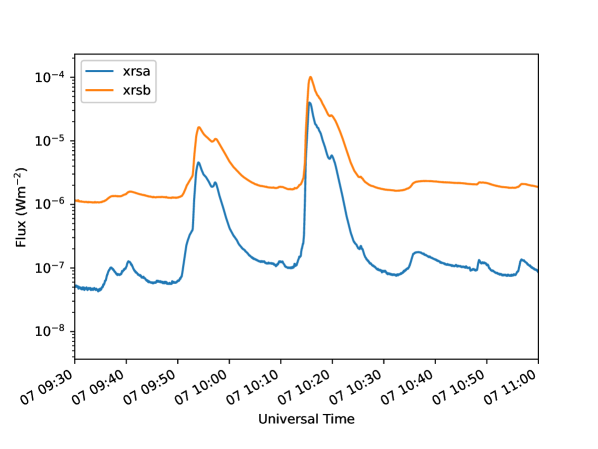
fig:goes

Similarly, we have studied 1531 type III bursts and found that 426 of them were flare associated. By knowing the class, location of the flare, we have studied the way these parameters affects the lower and upper frequency cut-off of type III bursts.
3 Results and discussions
Res
After a careful manual inspection of the catalog of type III bursts that are listed at http://www.iiserpune.ac.in/~p.subramanian/Bursts.zip, we have identified 1531 intense and well separated type III bursts observed in the frequency range 45 - 410 MHz during 2013- 2017. We have found that among them only 426 (28%) bursts are associated with the flares. The remaining 1105 type III bursts (72%) presumably originated due to small scale features that are present in solar corona and they are the signatures of weak energy releases reported earlier in literature (Ramesh et al., 2010, 2013; James, Subramanian, and Kontar, 2017; James and Subramanian, 2018; Sharma, Oberoi, and Arjunwadkar, 2018; Mugundhan et al., 2016, 2018; Singh et al., 2019).
We have then identified the type III bursts that are observed during onset - end time of the flares. Assuming that such bursts are associated with the flaring processes, we have measured the flare class, location and onset and end timings of the flares and studied the way these parameters vary with lower, upper frequency cutoff of type III bursts. Firstly, we have plotted the heliographic longitudes and latitudes of the flares associated with the type III bursts as shown in Figure \ireffig:longVsLat. We have found that most of the type III bursts originated close to the equator (i.e. heliographic latitudes ) except the three instances that occurred near the polar cap of the southern hemisphere.
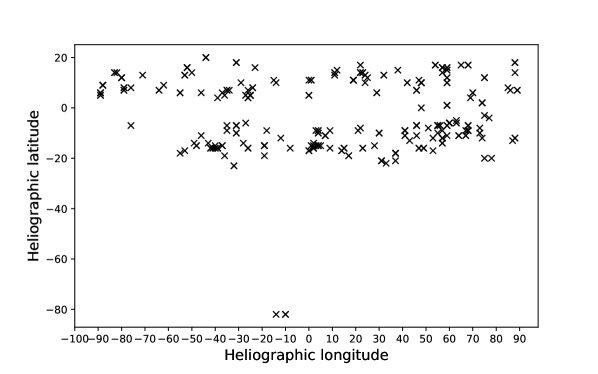
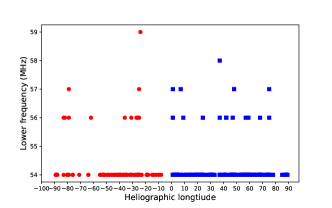
Figure \ireffig:long_freq shows the variation of lower and upper frequency of the type III bursts with heliographic longitude and latitude of the associated flares. Panel (a) shows the variation of heliographic longitude of flare and its upper frequency of the burst. The red and blue colors indicate the east and west heliographic longitudes. It is clearly seen that type III bursts whose upper frequency cutoff is larger are originated from the west longitudes than the east longitudes. We interpret that, it is due to the following facts (i) the Parker spirals from the west longitudes are directed toward the earth, (ii) type III bursts possesses the directivity, and (iii) type III bursts are more directive at high frequencies than the low frequencies. Panel (b) shows variation of lower frequency with the heliographic longitudes. It doesn’t show any trend because of instrumental limitation (i.e. we can not observe below 45 MHz). Panels (c) and (d) shows variation of upper and lower frequencies with the heliographic latitudes respectively and they show that most of the flare associated type III bursts are originated in the heliographic latitude range of . This study suggests also, that a few of the bursts are observed from southern polar cap regions. The red and blue color regions in panel (c) and (d) indicate the southern and northern latitudes respectively.

(a) (b)


(c) (d)
We have studied the relationship between onset, peak and end time of the flare and start time of the type III bursts. In Figure \ireffig:timeplots, left panel shows burst start time - flare onset time vs number of bursts. It is evident that most of the bursts in this sample are originated within 30 mins after onset of the flare. The right panel shows burst time - peak time of the flare vs number of bursts. It is evident from the plot that most of the type III bursts are occurred close to peak of the flare (approximately mins to the peak).


In Figure \ireffig:char, panel (a) shows the upper frequency cut-off of radio bursts vs the number of observed radio bursts. The blue and red color bars in panel (a) indicate total number of bursts and flare associated bursts respectively. It is evident from the plot that both total number of bursts and flare associated bursts when plotted against upper frequency cutoff of bursts shows a power law. Panel (b) shows total number of bursts (in blue) and flare associated bursts (in red) that are observed in different years. We found that total number of bursts observed in different years weakly correlates with the yearly averaged sunspot number (the green curve). Note that we have used the sunspot number666http://www.sidc.be/silso/datafiles provided by Clette et al. (2016). Panel (c) shows variation of number of flare associated type III bursts with the heliographic longitudes. The blue and red histograms indicate the east and west longitudes respectively. This plot is evident that total number of flare associated bursts in the west longitudes are higher than the east. As previously mentioned this could be due to the fact that type III bursts possesses directivity and also Parker spirals that are originated in the west longitudes are directed towards the earth. In the east longitudes it is possible that although there exist equal number of bursts when compared to west longitudes, because of their directivity we could not observe part of bursts from the earth. Panel (d) shows the class of the flares classified based on GOES X ray flux vs the number of flare associated bursts. In this study, out of 426 flare association bursts, we have found 239 (56%) bursts are due to C-class, 136 (32%) bursts are due to B-class, 136 (32%) bursts belongs to M-class and one bursts is due to X-class flare. We do not observe any A-class flare associated bursts, presumably because the sensitivity of CALLISTO spectrometer is not sufficient. From the plot, it can be noticed that most of the type III bursts are triggered by C-class flares.


(a) (b)


(c) (d)
4 Summary and Conclusions
Summ
We have studied 1531 type III bursts observed in the frequency range 45 - 410 MHz during 2013 - 2017. The observations are carried out using CALLISTO spectrometer that is located at the Gauribidanur Radio Observatory, India. We have carried out the statistical study of the way upper and lower frequency cutoff vary with onset - peak - end times of flare associated type III bursts, flare class and location of the active region. Conclusions that are drawn from this study are given below.
-
•
We have found that only 28 of bursts are flare associated and the remaining bursts may be originated from the weak energy release events (like jets) that are present in the solar corona.
-
•
We found that most of the type III bursts in this sample are triggered by the C-class flares.
-
•
We found that most of the flare associated type III bursts are observed to be originated from the active regions whose heliographic latitudes are . Note that this work is carried out during 2013 - 2017 (i.e. during solar cycle 24); it will be interesting to carry out similar studies at different phases of solar cycle and magnetic polarities.
-
•
We found that the bursts whose upper frequency is higher than 350 MHz are originated from the west longitudes. We interprete them that it could be due to the fact that Parker spirals from the west longitudes are directing towards the earth and type III bursts possesses the directivity. Also this work is corroborating the fact that high frequency type III bursts are more directive than low frequency bursts (Singh et al., 2019).
-
•
We found that most of the type III bursts are occurred within 30 minutes of the onset of the flare.
-
•
It was observed that the most of the type III bursts are occurred during the peak time of the flare (with in mins from the peak of the flare).
-
•
We found that both total number of bursts and flare associated bursts show the power law when plotted against upper frequency cutoff of the type III bursts.
-
•
We found that yearly measured total number of type III burst and flare associated bursts weakly correlates with the yearly averaged sunspot numbers.
-
•
This study infers that number of bursts observed from the west longitudes are larger than the ones from the east longitudes. Presumably, some of the bursts originated in the east longitudes doesn’t reach earth because of their high directivity.
Acknowledgments
The sunspot number used in this article is credited to WDC-SILSO, Royal Observatory of Belgium, Brussels. This research used version 2.0.1 of the SunPy open source software package (The SunPy Community et al., 2020). We thank the data centre of the e-Callisto network which is hosted by the FHNW, Institute for Data Science, Switzerland. We thank the referee for his constructive suggestions of the manuscript.
References
- Benz et al. (2009) Benz, A.O., Monstein, C., Meyer, H., Manoharan, P.K., Ramesh, R., Altyntsev, A., Lara, A., Paez, J., Cho, K.-S.: 2009, A World-Wide Net of Solar Radio Spectrometers: e-CALLISTO. Earth Moon and Planets 104(1-4), 277. DOI. ADS.
- Clette et al. (2016) Clette, F., Lefèvre, L., Cagnotti, M., Cortesi, S., Bulling, A.: 2016, The Revised Brussels-Locarno Sunspot Number (1981 - 2015). Sol. Phys. 291(9-10), 2733. DOI. ADS.
- Ginzburg and Zhelezniakov (1958) Ginzburg, V.L., Zhelezniakov, V.V.: 1958, On the Possible Mechanisms of Sporadic Solar Radio Emission (Radiation in an Isotropic Plasma). Soviet Ast. 2, 653. ADS.
- James and Subramanian (2018) James, T., Subramanian, P.: 2018, Energetics of small electron acceleration episodes in the solar corona from radio noise storm observations. MNRAS 479(2), 1603. DOI. ADS.
- James, Subramanian, and Kontar (2017) James, T., Subramanian, P., Kontar, E.P.: 2017, Small electron acceleration episodes in the solar corona. MNRAS 471(1), 89. DOI. ADS.
- Kerdraon and Delouis (1997) Kerdraon, A., Delouis, J.-M.: 1997, In: Trottet, G. (ed.) The Nançay Radioheliograph 483, 192. DOI. ADS.
- Kishore et al. (2015) Kishore, P., Ramesh, R., Kathiravan, C., Rajalingam, M.: 2015, A Low-Frequency Radio Spectropolarimeter for Observations of the Solar Corona. Sol. Phys. 290(9), 2409. DOI. ADS.
- Kishore et al. (2017) Kishore, P., Kathiravan, C., Ramesh, R., Ebenezer, E.: 2017, Coronal Magnetic Field Lines and Electrons Associated with Type III-V Radio Bursts in a Solar Flare. Journal of Astrophysics and Astronomy 38(2), 24. DOI. ADS.
- Lemen et al. (2012) Lemen, J.R., Title, A.M., Akin, D.J., Boerner, P.F., Chou, C., Drake, J.F., Duncan, D.W., Edwards, C.G., Friedlaender, F.M., Heyman, G.F., Hurlburt, N.E., Katz, N.L., Kushner, G.D., Levay, M., Lindgren, R.W., Mathur, D.P., McFeaters, E.L., Mitchell, S., Rehse, R.A., Schrijver, C.J., Springer, L.A., Stern, R.A., Tarbell, T.D., Wuelser, J.-P., Wolfson, C.J., Yanari, C., Bookbinder, J.A., Cheimets, P.N., Caldwell, D., Deluca, E.E., Gates, R., Golub, L., Park, S., Podgorski, W.A., Bush, R.I., Scherrer, P.H., Gummin, M.A., Smith, P., Auker, G., Jerram, P., Pool, P., Soufli, R., Windt, D.L., Beardsley, S., Clapp, M., Lang, J., Waltham, N.: 2012, The Atmospheric Imaging Assembly (AIA) on the Solar Dynamics Observatory (SDO). Sol. Phys. 275(1-2), 17. DOI. ADS.
- Melrose (1980) Melrose, D.B.: 1980, The Emission Mechanisms for Solar Radio Bursts. Space Sci. Rev. 26(1), 3. DOI. ADS.
- Monstein, Ramesh, and Kathiravan (2007) Monstein, C., Ramesh, R., Kathiravan, C.: 2007, Radio spectrum measurements at the Gauribidanur observatory. Bulletin of the Astronomical Society of India 35, 473. ADS.
- Mugundhan et al. (2016) Mugundhan, V., Ramesh, R., Barve, I.V., Kathiravan, C., Gireesh, G.V.S., Kharb, P., Misra, A.: 2016, Low-Frequency Radio Observations of the Solar Corona with Arcminute Angular Resolution: Implications for Coronal Turbulence and Weak Energy Releases. ApJ 831(2), 154. DOI. ADS.
- Mugundhan et al. (2018) Mugundhan, V., Ramesh, R., Kathiravan, C., Gireesh, G.V.S., Kumari, A., Hariharan, K., Barve, I.V.: 2018, The First Low-frequency Radio Observations of the Solar Corona on 200 km Long Interferometer Baseline. ApJ 855(1), L8. DOI. ADS.
- Pesnell, Thompson, and Chamberlin (2012) Pesnell, W.D., Thompson, B.J., Chamberlin, P.C.: 2012, The Solar Dynamics Observatory (SDO). Sol. Phys. 275(1-2), 3. DOI. ADS.
- Ramesh (2011) Ramesh, R.: 2011, Low frequency solar radio astronomy at the Indian Institute of Astrophysics (IIA). In: Astronomical Society of India Conference Series, Astronomical Society of India Conference Series 2, 55. ADS.
- Ramesh (2014) Ramesh, R.: 2014, Solar observations at low frequencies with the Gauribidanur radioheliograph. In: Chengalur, J.N., Gupta, Y. (eds.) Metrewavelength Sky, Astron. Soc. India Conf. Ser. 13, 19. ADS.
- Ramesh et al. (2003) Ramesh, R., Kathiravan, C., Narayanan, A.S., Ebenezer, E.: 2003, Metric observations of transient, quasi-periodic radio emission from the solar corona in association with a “halo“ CME and an “EIT wave” event. A&A 400, 753. DOI. ADS.
- Ramesh et al. (2005) Ramesh, R., Narayanan, A.S., Kathiravan, C., Sastry, C.V., Shankar, N.U.: 2005, An estimation of the plasma parameters in the solar corona using quasi-periodic metric type III radio burst emission. A&A 431, 353. DOI. ADS.
- Ramesh et al. (2010) Ramesh, R., Kathiravan, C., Barve, I.V., Beeharry, G.K., Rajasekara, G.N.: 2010, Radio Observations of Weak Energy Releases in the Solar Corona. ApJ 719(1), L41. DOI. ADS.
- Ramesh et al. (2013) Ramesh, R., Sasikumar Raja, K., Kathiravan, C., Narayanan, A.S.: 2013, Low-frequency Radio Observations of Picoflare Category Energy Releases in the Solar Atmosphere. ApJ 762(2), 89. DOI. ADS.
- Reid and Ratcliffe (2014) Reid, H.A.S., Ratcliffe, H.: 2014, A review of solar type III radio bursts. Research in Astronomy and Astrophysics 14(7), 773. DOI. ADS.
- Saint-Hilaire, Vilmer, and Kerdraon (2013) Saint-Hilaire, P., Vilmer, N., Kerdraon, A.: 2013, A Decade of Solar Type III Radio Bursts Observed by the Nançay Radioheliograph 1998-2008. ApJ 762(1), 60. DOI. ADS.
- Sasikumar Raja and Ramesh (2013) Sasikumar Raja, K., Ramesh, R.: 2013, Low-frequency Observations of Transient Quasi-periodic Radio Emission from the Solar Atmosphere. ApJ 775(1), 38. DOI. ADS.
- Sasikumar Raja et al. (2018) Sasikumar Raja, K., Subramanian, P., Ananthakrishnan, S., Monstein, C.: 2018, CALLISTO Spectrometer at IISER-Pune. arXiv e-prints, arXiv:1801.03547. ADS.
- Schou et al. (2012) Schou, J., Scherrer, P.H., Bush, R.I., Wachter, R., Couvidat, S., Rabello-Soares, M.C., Bogart, R.S., Hoeksema, J.T., Liu, Y., Duvall, T.L., Akin, D.J., Allard, B.A., Miles, J.W., Rairden, R., Shine, R.A., Tarbell, T.D., Title, A.M., Wolfson, C.J., Elmore, D.F., Norton, A.A., Tomczyk, S.: 2012, Design and Ground Calibration of the Helioseismic and Magnetic Imager (HMI) Instrument on the Solar Dynamics Observatory (SDO). Sol. Phys. 275(1-2), 229. DOI. ADS.
- Sharma, Oberoi, and Arjunwadkar (2018) Sharma, R., Oberoi, D., Arjunwadkar, M.: 2018, Quantifying Weak Nonthermal Solar Radio Emission at Low Radio Frequencies. ApJ 852(2), 69. DOI. ADS.
- Singh et al. (2019) Singh, D., Sasikumar Raja, K., Subramanian, P., Ramesh, R., Monstein, C.: 2019, Automated Detection of Solar Radio Bursts Using a Statistical Method. Sol. Phys. 294(8), 112. DOI. ADS.
- Stewart (1974) Stewart, R.T.: 1974, Harmonic Ratios of Inverted-U Type III Bursts. Sol. Phys. 39(2), 451. DOI. ADS.
- Suzuki and Sheridan (1982) Suzuki, S., Sheridan, K.V.: 1982, On the fundamental and harmonic components of low-frequency Type III solar radio bursts. Proceedings of the Astronomical Society of Australia 4, 382. DOI. ADS.
- The SunPy Community et al. (2020) The SunPy Community, Barnes, W.T., Bobra, M.G., Christe, S.D., Freij, N., Hayes, L.A., Ireland, J., Mumford, S., Perez-Suarez, D., Ryan, D.F., Shih, A.Y., Chanda, P., Glogowski, K., Hewett, R., Hughitt, V.K., Hill, A., Hiware, K., Inglis, A., Kirk, M.S.F., Konge, S., Mason, J.P., Maloney, S.A., Murray, S.A., Panda, A., Park, J., Pereira, T.M.D., Reardon, K., Savage, S., Sipőcz, B.M., Stansby, D., Jain, Y., Taylor, G., Yadav, T., Rajul, Dang, T.K.: 2020, The sunpy project: Open source development and status of the version 1.0 core package. The Astrophysical Journal 890. DOI. https://iopscience.iop.org/article/10.3847/1538-4357/ab4f7a.
- Wild (1950) Wild, J.P.: 1950, Observations of the Spectrum of High-Intensity Solar Radiation at Metre Wavelengths. III. Isolated Bursts. Australian Journal of Scientific Research A Physical Sciences 3, 541. DOI. ADS.
- Zheleznyakov and Zaitsev (1970) Zheleznyakov, V.V., Zaitsev, V.V.: 1970, Contribution to the Theory of Type III Solar Radio Bursts. I. Soviet Ast. 14, 47. ADS.
- Zucca et al. (2012) Zucca, P., Carley, E.P., McCauley, J., Gallagher, P.T., Monstein, C., McAteer, R.T.J.: 2012, Observations of Low Frequency Solar Radio Bursts from the Rosse Solar-Terrestrial Observatory. Sol. Phys. 280(2), 591. DOI. ADS.