A self consistent theory of Gaussian Processes
captures feature learning effects in finite CNNs
Abstract
Deep neural networks (DNNs) in the infinite width/channel limit have received much attention recently, as they provide a clear analytical window to deep learning via mappings to Gaussian Processes (GPs). Despite its theoretical appeal, this viewpoint lacks a crucial ingredient of deep learning in finite DNNs, laying at the heart of their success — feature learning. Here we consider DNNs trained with noisy gradient descent on a large training set and derive a self consistent Gaussian Process theory accounting for strong finite-DNN and feature learning effects. Applying this to a toy model of a two-layer linear convolutional neural network (CNN) shows good agreement with experiments. We further identify, both analytical and numerically, a sharp transition between a feature learning regime and a lazy learning regime in this model. Strong finite-DNN effects are also derived for a non-linear two-layer fully connected network. Our self consistent theory provides a rich and versatile analytical framework for studying feature learning and other non-lazy effects in finite DNNs.
I Introduction
The correspondence between Gaussian Processes (GPs) and deep neural networks (DNNs) has been instrumental in advancing our understanding of these complex algorithms. Early results related randomly initialized strongly over-parameterized DNNs with GP priors [31, 21, 28]. More recent results considered training using gradient flow (or noisy gradients), where DNNs map to Bayesian inference on GPs governed by the neural tangent kernel [19, 22] (or the NNGP kernel [30]). These correspondences carry over to a wide variety of architectures, going beyond fully connected networks (FCNs) to convolutional neural networks (CNNs) [3, 34], recurrent neural networks (RNNs) [1] and even attention networks [18]. They provide us with closed analytical expressions for the outputs of strongly over-parameterized trained DNNs, which have been used to make accurate predictions for DNN learning curves [10, 8, 7].
Despite their theoretical appeal, GPs are unable to capture feature learning [42, 41], which is a well-observed key property of trained DNNs. Indeed, it was noticed [19] that as the width tends to infinity, the neural tangent kernel (NTK) tends to a constant kernel that does not evolve during training and the weights in hidden layers change infinitesimally from their initialization values. This regime of training was thus dubbed lazy training [9]. Other studies showed that for CNNs trained on image classification tasks, the feature learning regime generally tends to outperform the lazy regime [13, 14, 23]. Clearly, working in the feature learning regime is also crucial for performing transfer learning [40, 41].
It is therefore desirable to have a theoretical approach to deep learning which enjoys the generality and analytical power of GPs while capturing feature learning effects in finite DNNs. Here we make several contributions towards this goal:
-
1.
We show that the mean predictor of a finite DNN trained on a large data set with noisy gradients, weight decay and MSE loss, can be obtained from GP regression on a shifted target (§III). Central to our approach is a non-linear self consistent equation involving the higher cumulants of the finite DNN (at initialization) which predicts this target shift.
-
2.
Using this machinery on a toy model of a two-layer linear CNN in a teacher-student setting, we derive explicit analytical predictions which are in very good agreement with experiments even well away from the GP/lazy-learning regime (large number of channels, ) thus accounting for strong finite-DNN corrections (§IV). Similarly strong corrections to GPs, yielding qualitative improvements in performance, are demonstrated for the quadratic two-layer fully connected model of Ref. [26].
-
3.
We show how our framework can be used to study statistical properties of weights in hidden layers. In particular, in the CNN toy model, we identify, both analytically and numerically, a sharp transition between a feature learning phase and a lazy learning phase (§IV.4). We define the feature learning phase as the regime where the features of the teacher network leave a clear signature in the spectrum of the student’s hidden weights posterior covariance matrix. In essence, this phase transition is analogous to the transition associated with the recovery of a low-rank signal matrix from a noisy matrix taken from the Wishart ensemble, when varying the strength of the low-rank component [5].
I.1 Additional related work
Several previous papers derived leading order finite-DNN corrections to the GP results [30, 39, 12]. While these results are in principle extendable to any order in perturbation theory, such high order expansions have not been studied much, perhaps due to their complexity. In contrast, we develop an analytically tractable non-perturbative approach which we find crucial for obtaining non-negligible feature learning and associated performance enhancement effects.
Previous works [13, 14] studied how the behavior of infinite DNNs depends on the scaling of the top layer weights with its width. In [40] it is shown that the standard and NTK parameterizations of a neural network do not admit an infinite-width limit that can learn features, and instead suggest an alternative parameterization which can learn features in this limit. While unifying various viewpoints on infinite DNNs, this approach does not immediately lend itself to analytical analysis of the kind proposed here.
Several works [36, 25, 15, 2] show that finite width models can generalize either better or worse than their infinite width counterparts, and provide examples where the relative performance depends on the optimization details, the DNN architecture and the statistics of the data. Here we demonstrate analytically that finite DNNs outperform their GP counterparts when the latter have a prior that lacks some constraint found in the data (e.g. positive-definiteness [26], weight sharing [34]).
Deep linear networks (FCNs and CNNs) similar to our CNN toy example have been studied in the literature [4, 37, 20, 16]. These studies use different approaches and assumptions and do not discuss the target shift mechanism which applies also for non-linear CNNs. In addition, their analytical results hinge strongly on linearity whereas our approach could be useful whenever several leading cumulants of the DNN output are known.
A concurrent work [43] derived exact expressions for the output priors of finite FCNs induced by Gaussian priors over their weights. However, these results only apply to the limited case of a prior over a single training point and only for a FCN. In contrast, our approach applies to the setting of a large training set, it is not restricted to FCNs and yields results for the posterior predictions, not the prior. Focusing on deep linear fully connected DNNs, recent work [24] derived analytical finite-width renormalization results for the GP kernel, by sequentially integrating out the weights of the DNN, starting from the output layer and working backwards towards the input. Our analytical approach, its scope, and the models studied here differ substantially from that work.
II Preliminaries
We consider a fixed set of training inputs and a single test point over which we wish to model the distribution of the outputs of a DNN. We consider a generic DNN architecture where for simplicity we assume a scalar output . The learnable parameters of the DNN that determine its output, are collected into a single vector . We pack the outputs evaluated on the training set and on the test point into a vector , where we denoted the test point as . We train the DNNs using full-batch gradient decent with weight decay and external white Gaussian noise. The discrete dynamics of the parameters are thus
| (1) |
where is the vector of all network parameters at time step , is the strength of the weight decay, is the loss as a function of the DNN output (where we have emphasized the dependence on the parameters ), is the magnitude of noise, is the learning rate and . As this discrete-time dynamics converge to the continuous-time Langevin equation given by with , so that as the DNN parameters will be sampled from the equilibrium Gibbs distribution .
As shown in [30], the parameter distribution induces a posterior distribution over the trained DNN outputs with the following partition function:
| (2) |
Here is the prior generated by the finite-DNN with drawn from where the weight decay may be layer-dependent, are the training targets and are source terms used to calculate the statistics of . We keep the loss function arbitrary at this point, committing to a specific choice in the next section. As standard [17], to calculate the posterior mean at any of the training points or the test point from this partition function one uses
| (3) |
III A self consistent theory for the posterior mean and covariance
In this section we show that for a large training set, the posterior mean predictor (Eq. 3) amounts to GP regression on a shifted target (). This shift to the target () is determined by solving certain self-consistent equations involving the cumulants of the prior . For concreteness, we focus here on the MSE loss and comment on extensions to other losses, e.g. the cross entropy, in App. C. To this end, consider first the prior of the output of a finite DNN. Using standard manipulations (see App. A), it can be expressed as follows
| (4) |
where is the ’th multivariate cumulant of [29]. The second term in the exponent is the cumulant generating function () corresponding to . As discussed in App. B and Ref. [30], for standard initialization protocols the ’th cumulant will scale as , where controls the over-parameterization. The second () cumulant which is -independent, describes the NNGP kernel of the finite DNN and is denoted by .
Consider first the case of [21, 28, 31] where all cumulants vanish. Here one can explicitly perform the integration in Eq. 4 to obtain the standard GP prior . Plugging this prior into Eq. 2 with MSE loss, one recovers standard GP regression formulas [35]. In particular, the predictive mean at is: where and . Another set of quantities we shall find useful are the discrepancies in GP prediction, which for the training set read
| (5) |
Saddle point approximation for the mean predictor.
For a DNN with finite , the prior will no longer be Gaussian and cumulants with would contribute. This renders the partition function in Eq. 2 intractable and so some approximation is needed to make progress. To this end we note that can be integrated out (see App. A.1) to yield a partition function of the form
| (6) |
where is the action whose exact form is given in Eq. A.14. Interestingly, the variables appearing above are closely related to the discrepancies , in particular .
To proceed analytically we adopt the saddle point (SP) approximation [11] which, as argued in App. A.4, relies on the fact that the non-linear terms in the action comprise of a sum of many ’s. Given that this sum is dominated by collective effects coming from all data points, expanding around the saddle point yields terms with increasingly negative powers of .
For the training points , taking the saddle point approximation amounts to setting . This yields a set of equations that has precisely the form of Eq. 5, but where the target is shifted as and the target shift is determined self consistently by
| (7) |
Equation 7 is thus an implicit equation for involving all training points, and it holds for the training set and the test point . Once solved, either analytically or numerically, one calculates the predictions on the test point via
| (8) |
Equation 5 with along with Eqs. 7 and 8 are the first main result of this paper. Viewed as an algorithm, the procedure to predict the finite DNN’s output on a test point is as follows: we shift the target in Eq. 5 as with as in Eq. 7, arriving at a closed equation for the average discrepancies on the training set. For some models, the cumulants can be computed for any order and it can be possible to sum the entire series, while for other models several leading cumulants might already give a reasonable approximation due to their scaling. The resulting coupled non-linear equations can then be solved numerically, to obtain from which predictions on the test point are calculated using Eq. 8.
Notwithstanding, solving such equations analytically is challenging and one of our main goals here is to provide concrete analytical insights. Thus, in §IV.2 we propose an additional approximation wherein to leading order we replace all summations over data-points with integrals over the measure from which the data-set is drawn. This approximation, taken in some cases beyond leading order as in Ref. [10], will yield analytically tractable equations which we solve for two simple toy models, one of a linear CNN and the other of a non-linear FCN.
Saddle point plus Gaussian fluctuations for the posterior covariance.
The SP approximation can be extended to compute the predictor variance by expanding the action to quadratic order in around the SP value (see App. A.3). Due to the saddle-point being an extremum this leads to . This leaves the previous SP approximation for the posterior mean on the training set unaffected (since the mean and maximizer of a Gaussian coincide), but is necessary to get sensible results for the posterior covariance. Empirically, in the toy models we considered in §IV we find that the finite DNN corrections to the variance are much less pronounced than those for the mean. Using the standard Gaussian integration formula, one finds that is the covariance matrix of . Performing such an expansion one finds
| (9) | ||||
where the on the r.h.s. are those of the saddle point. This gives an expression for the posterior covariance matrix on the training set:
| (10) |
where the r.h.s. coincides with the posterior covariance of a GP with a kernel equal to [35]. The variance on the test point is given by (repeating indices are summed over the training set)
| (11) |
where here is as in Eq. 7 but where the ’s are replaced the ’s that have Gaussian fluctuations, and is without the second cumulant (see App. A.1). The first two terms in Eq. 11 yield the standard result for the GP posterior covariance matrix on a test point [35], for the case of (see Eq. 9). The rest of the terms can be evaluated by the SP plus Gaussian fluctuations approximation, where the details would depend on the model at hand.
IV Two toy models
IV.1 The two layer linear CNN and its properties
Here we define a teacher-student toy model showing several qualitative real-world aspects of feature learning and analyze it via our self-consistent shifted target approach. Concretely, we consider the simplest student CNN , having one hidden layer with linear activation, and a corresponding teacher CNN,
| (12) |
This describes a CNN that performs 1-dimensional convolution where the convolutional weights for each channel are . These are dotted with a convolutional window of the input and there are no overlaps between them so that . Namely, the input dimension is , where is the number of (non-overlapping) convolutional windows, is the stride of the conv-kernel and it is also the length of the conv-kernel, hence there is no overlap between the strides. The inputs are sampled from .
Despite its simplicity, this model distils several key differences between feature learning models and lazy learning or GP models. Due to the lack of pooling layers, the GP associated with the student fails to take advantage of the weight sharing property of the underlying CNN [34]. In fact, here it coincides with a GP of a fully-connected DNN which is quite inappropriate for the task. We thus expect that the finite network will have good performance already for whereas the GP will need of order of the dimension () to learn well [10]. Thus, for there should be a broad regime in the value of where the finite network substantially outperforms the corresponding GP. We later show (§IV.4) that this performance boost over GP is due to feature learning, as one may expect.
Conveniently, the cumulants of the student DNN of any order can be worked out exactly. Assuming and of the noisy GD training are chosen such that111Generically this requires dependent and layer dependent weight decay. (and similarly for the teacher DNN) the covariance function for the associated GP reads
| (13) |
Denoting , the even cumulant of arbitrary order is (see App. F):
| (14) |
while all odd cumulants vanish due to the sign flip symmetry of the last layer. In this notation, we mean that the ’s stand for integers in and e.g. and the bracket notation stands for the number of ways to pair the integers into the above form. This result can then be plugged in 7 to obtain the self consistent (saddle point) equations on the training set. See App. A.4 for a convergence criterion for the saddle point, supporting its application here.
IV.2 Self consistent equation in the limit of a large training set
In §III our description of the self consistent equations was for a finite and fixed training set. Further analytical insight can be gained if we consider the limit of a large training set, known in the GP literature as the Equivalent Kernel (EK) limit [35, 38]. For a short review of this topic, see App. D. In essence, in the EK limit we replace the discrete sums over a specific draw of training set, as in Eqs. 5, 7, 8, with integrals over the entire input distribution . Given a kernel that admits a spectral decomposition in terms of its eigenvalues and eigenfunctions: , the standard result for the GP posterior mean at a test point is approximated by [35]
| (15) |
This has several advantages, already at the level of GP analysis. From a theoretical point of view, the integral expressions retain the symmetries of the kernel unlike the discrete sums that ruin these symmetries. Also, Eq. 15 does not involve computing the inverse matrix which is costly for large matrices.
In the context of our theory, the EK limit allows for a derivation of a simple analytical form for the self consistent equations. As shown in App. E.1 in our toy CNN both and become linear in the target. Thus the self-consistent equations can be reduced to a single equation governing the proportionality factor () between and (). Thus starting from the general self consistent equations, 5, 7, 8, taking their EK limit, and plugging in the general cumulant for our toy model (14) we arrive at the following equation for
| (16) |
Setting for simplicity we have and we also introduced the constant where is computed using the empirical GP predictions on either the training set or test set: , or analytically in the perturbation theory approach developed in [10]. The quantity has an interpretation as corrections to the EK approximation [10] but here can be considered as a fitting parameter. It is non-negative and is typically ; for more details and analytical estimates see App. E.2.
Equation 16 is the second main analytical result of this work. It simplifies the highly non-linear inference problem to a single equation that embodies strong non-linear finite-DNN effect and feature learning (see also §IV.4). In practice, to compute we numerically solve 16 using for the training set to get , and then set in the r.h.s. of 16 but use . Equation 16 can also be used to bound analytically on both the training set and test point, given the reasonable assumption that changes continuously with . Indeed, at large the pole in this equation lays at whereas . As diminishes, continuity implies that must remain smaller than . The latter decays as implying that the amount of data required for good performance scales as rather than as in the GP case.
IV.3 Numerical verification
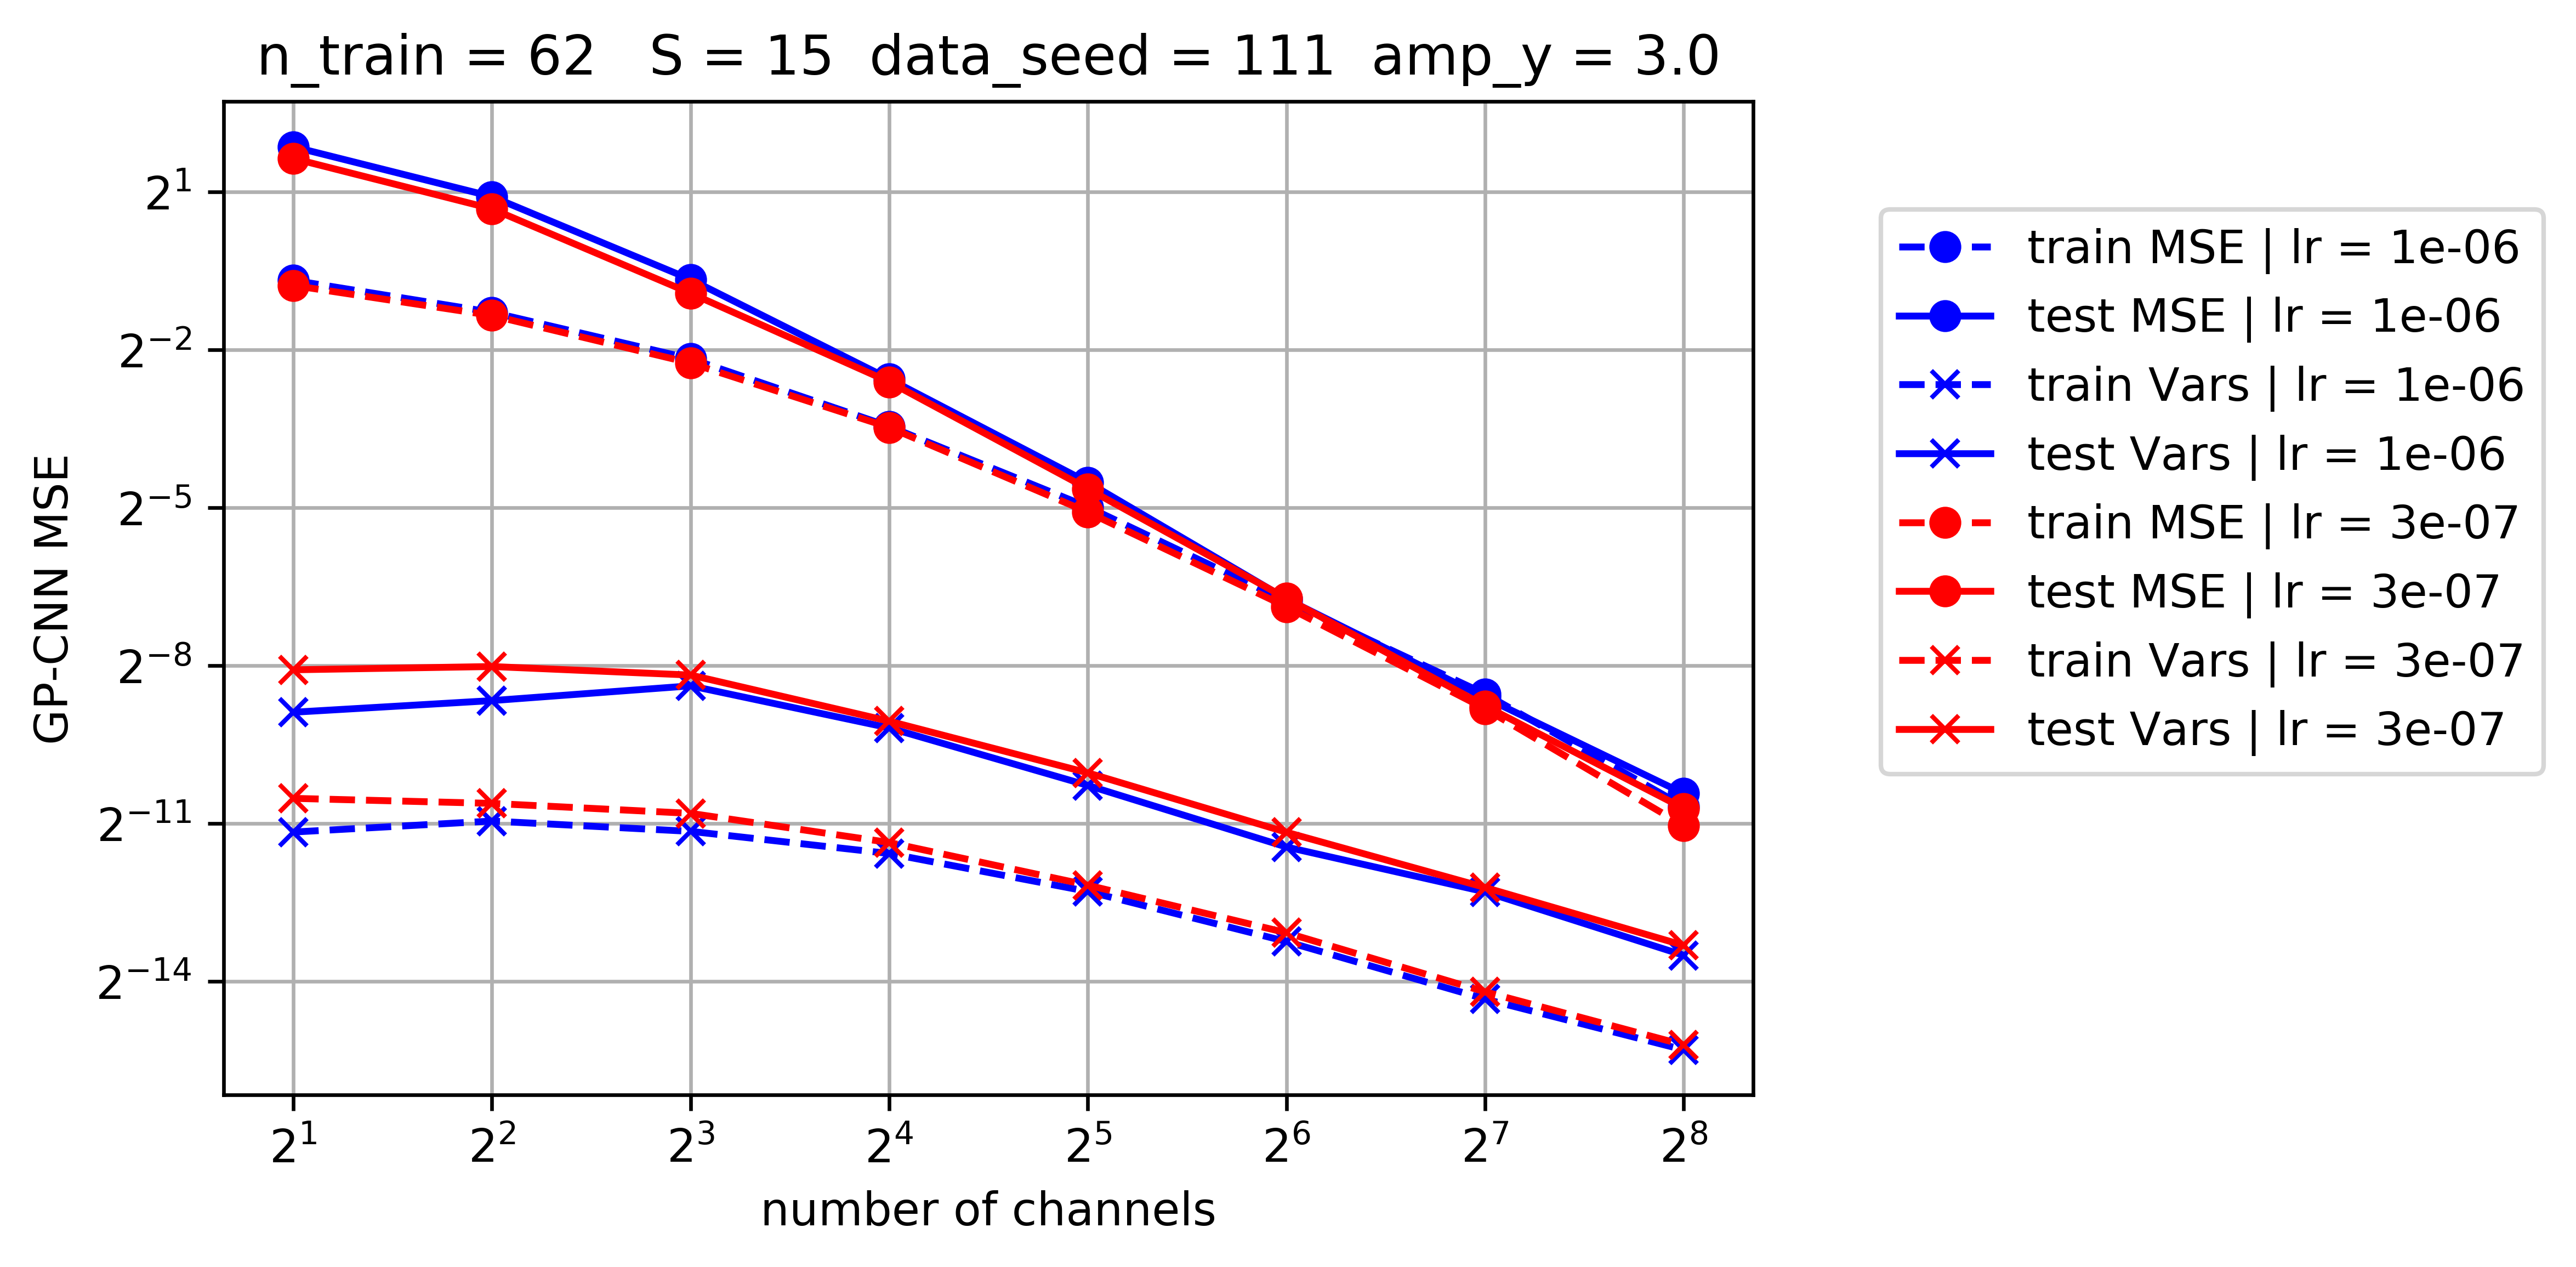
In this section we numerically verify the predictions of the self consistent theory of Sec. §IV.2, by training linear shallow student CNNs on a teacher with as in Eq. 12, using noisy gradients as in Eq. 1, and averaging their outputs across noise realizations and across dynamics after reaching equilibrium.
For simplicity we used and so that . The latter scaling places us in the poorly performing regime of the associated GP while allowing good performance of the CNN. Indeed, as aforementioned, the GP here requires of the scale of for good performance [10], while the CNN requires of scale of the number of parameters ().
The results are shown in Fig 1 where we compare the theoretical predictions given by the solutions of the self consistent equation (16) to the empirical values of obtained by training actual CNNs and averaging their outputs across the ensemble.
(A)
 (B)
(B)

IV.4 Feature learning phase transition in the CNN model
At this point there is evidence that our self-consistent shifted target approach works well within the feature learning regime of the toy model. Indeed GP is sub-optimal here, since it does not represent the CNN’s weight sharing present in the teacher network. Weight sharing is intimately tied with feature learning in the first layer, since it aggregates the information coming from all convolutional windows to refine a single set of repeating convolution-filters. Empirically, we observed a large performance gap of finite CNNs over the infinite- (GP) limit, which was also observed previously in more realistic settings [23, 13, 34]. Taken together with the existence of a clear feature in the teacher, a natural explanation for this performance gap is that feature learning, which is completely absent in GPs, plays a major role in the behavior of finite CNNs.
To analyze this we wish to track how the feature of the teacher are reflected in the student network’s first layer weights across training time (after reaching equilibrium) and across training realizations. However, as our formalism deals with ensembles of DNNs, computing averages of with respect to these ensembles would simply give zero. Indeed, the chance of a DNN with specific parameters appearing is the same as that of . Consequently, to detect feature learning the first reasonable object to examine is the empirical covariance matrix , where the matrix has as its ’th column. This is invariant under such a change of signs and provides important information on the statistics of .
As shown in App. G, using our field-theory or function-space formulation, we find that to leading order in the ensemble average of the empirical covariance matrix, for a teacher with a single feature , is
| (17) |
A first conclusion that could be drawn here, is that given access to an ensemble of such trained CNNs, feature learning happens for any finite as a statistical property. We turn to discuss the more common setting where one wishes to use the features learned by a specific randomly chosen CNN from this ensemble.
To this end, we follow Ref. [27] and model as a Wishart matrix with a rank-one perturbation. The variance of the matrix and details of the rank one perturbation are then determined by the above equation. Consequently the eigenvalue distribution is expected to follow a spiked Marchenko-Pastur (MP), which was studied extensively in [6]. To test this modeling assumption, for each snapshot of training time (after reaching equilibrium) and noise realization we compute ’s eigenvalues and aggregate these across the ensemble. In Fig. 2 we plot the resulting empirical spectral distribution for varying values of while keeping fixed. Note that, differently from the usual spiked-MP model, varying here changes both the distribution of the MP bulk (which is determined by the ratio ) as well as the strength of the low-rank perturbation.
Our main finding is a phase transition between two regimes which becomes sharp as one takes . In the regime of large the eigenvalue distribution of is indistinguishable from the MP distribution, whereas in the regime of small an outlier eigenvalue departs from the support of the bulk MP distribution and the associated top eigenvector has a non-zero overlap with , see Fig. 2. We refer to the latter as the feature-learning regime, since the feature is manifested in the spectrum of the students weights, whereas the former is the non-feature learning regime. We use the quantity as a surrogate for , as it is valid on both sides of the transition. Having established the correspondence to the MP plus low rank model, we can use the results of [6] to find the exact location of the phase transition, which occurs at the critical value given by
| (18) |
where we assumed for simplicity so that .
(A)
 (B)
(B)

IV.5 Two-layer FCN with average pooling and quadratic activations
Another setting where GPs are expected to under-perform finite-DNNs is the case of quadratic fully connected teacher and student DNNs where the teacher is rank-1, also known as the phase retrieval problem [26]. Here we consider some positive target of the form where and a student DNN given by . We consider training this DNN on train points using noisy GD training with weight decay .
Similarly to the previous toy model, here too the GP associated with the student at large (and finite ) overlooks a qualitative feature of the finite DNN — the fact that the first term in is non-negative. Interestingly, this feature provides a strong performance boost [26] in the limit compared to the associated GP. Namely the DNN, even at large , performs well for [26] whereas the associated GP is expected to work well only for [10].
We wish to solve for the predictions of this model with our self consistent GP based approach. As shown in App. I, the cumulants of this model can be obtained from the following cumulant generating function
| (19) |
The associated GP kernel is given by . Following this, the target shift equation, at the saddle point level, appears as
| (20) |
In App. I, we solve these equations numerically for and show that our approach captures the correct threshold value. An analytic solution of these equations at low using EK or other continuum approximations is left for future work (see Refs. [10, 7, 8] for potential approaches). As a first step towards this goal, in App. I we consider the simpler case of and derive the asymptotics of the learning curves which deviate strongly from those of GP for .
V Discussion
In this work we presented a correspondence between ensembles of finite DNNs trained with noisy gradients and GPs trained on a shifted target. The shift in the target can be found by solving a set of self consistent equations for which we give a general form. We found explicit expressions for these equations for the case of a 2-layer linear CNN and a non-linear FCN, and solved them analytically and numerically. For the former model, we performed numerical experiments on CNNs that agree well with our theory both in the GP regime and well away from it, i.e. for small number of channels , thus accounting for strong finite effects. For the latter model, the numerical solution of these equations capture a remarkable and subtle effect in these DNNs which the GP approach completely overlooks — the threshold value.
Considering feature learning in the CNN model, we found that averaging over ensembles of such networks always leads to a form of feature learning. Namely, the teacher always leaves a signature on the statistics of the student’s weights. However, feature learning is usually considered at the level of a single DNN instance rather than an ensemble of DNNs. Focusing on this case, we show numerically that the eigenvalues of , the student hidden weights covariance matrix, follow a Marchenko–Pastur distribution plus a rank-1 perturbation. We then use our approach to derive the critical number of channels below which the student is in a feature learning regime.
There are many directions for future research. Our toy models where chosen to be as simple as possible in order to demonstrate the essence of our theory on problems where lazy learning grossly under-performs finite-DNNs. Even within this setting, various extensions are interesting to consider such as adding more features to the teacher CNN (e.g. biases or a subset of linear functions which are more favorable), studying linear CNNs with overlapping convolutional windows, or deeper linear CNNs. As for non-linear CNNs, we believe it is possible to find the exact cumulants of any order for a variety of toy CNNs involving, for example, quadratic activation functions. For other cases it may be useful to develop methods for characterizing and approximating the cumulants.
More generally, we advocated here a physics-style methodology using approximations, self-consistency checks, and experimental tests. As DNNs are very complex experimental systems, we believe this mode of research is both appropriate and necessary. Nonetheless we hope the insights gained by our approach would help generate a richer and more relevant set of toy models on which mathematical proofs could be made.
References
- Alemohammad et al. [2020] Alemohammad, S., Wang, Z., Balestriero, R., and Baraniuk, R. (2020). The recurrent neural tangent kernel. arXiv preprint arXiv:2006.10246.
- Andreassen and Dyer [2020] Andreassen, A. and Dyer, E. (2020). Asymptotics of wide convolutional neural networks. arXiv preprint arXiv:2008.08675.
- Arora et al. [2019] Arora, S., Du, S. S., Hu, W., Li, Z., Salakhutdinov, R., and Wang, R. (2019). On Exact Computation with an Infinitely Wide Neural Net. arXiv e-prints, page arXiv:1904.11955.
- Baldi and Hornik [1989] Baldi, P. and Hornik, K. (1989). Neural networks and principal component analysis: Learning from examples without local minima. Neural networks, 2(1), 53–58.
- Benaych-Georges and Nadakuditi [2011] Benaych-Georges, F. and Nadakuditi, R. R. (2011). The eigenvalues and eigenvectors of finite, low rank perturbations of large random matrices. Advances in Mathematics, 227(1), 494–521.
- Benaych-Georges and Nadakuditi [2012] Benaych-Georges, F. and Nadakuditi, R. R. (2012). The singular values and vectors of low rank perturbations of large rectangular random matrices. Journal of Multivariate Analysis, 111, 120–135.
- Bordelon et al. [2020] Bordelon, B., Canatar, A., and Pehlevan, C. (2020). Spectrum dependent learning curves in kernel regression and wide neural networks.
- Canatar et al. [2021] Canatar, A., Bordelon, B., and Pehlevan, C. (2021). Spectral bias and task-model alignment explain generalization in kernel regression and infinitely wide neural networks. Nature Communications, 12(1).
- Chizat et al. [2019] Chizat, L., Oyallon, E., and Bach, F. (2019). On lazy training in differentiable programming. In Advances in Neural Information Processing Systems, pages 2937–2947.
- Cohen et al. [2019] Cohen, O., Malka, O., and Ringel, Z. (2019). Learning Curves for Deep Neural Networks: A Gaussian Field Theory Perspective. arXiv e-prints, page arXiv:1906.05301.
- Daniels [1954] Daniels, H. E. (1954). Saddlepoint Approximations in Statistics. The Annals of Mathematical Statistics, 25(4), 631 – 650.
- Dyer and Gur-Ari [2020] Dyer, E. and Gur-Ari, G. (2020). Asymptotics of wide networks from feynman diagrams. In International Conference on Learning Representations.
- Geiger et al. [2020] Geiger, M., Spigler, S., Jacot, A., and Wyart, M. (2020). Disentangling feature and lazy training in deep neural networks. Journal of Statistical Mechanics: Theory and Experiment, 2020(11), 113301.
- Geiger et al. [2021] Geiger, M., Petrini, L., and Wyart, M. (2021). Landscape and training regimes in deep learning. Physics Reports.
- Ghorbani et al. [2020] Ghorbani, B., Mei, S., Misiakiewicz, T., and Montanari, A. (2020). When do neural networks outperform kernel methods? arXiv preprint arXiv:2006.13409.
- Gunasekar et al. [2018] Gunasekar, S., Lee, J., Soudry, D., and Srebro, N. (2018). Implicit bias of gradient descent on linear convolutional networks. arXiv preprint arXiv:1806.00468.
- Helias and Dahmen [2019] Helias, M. and Dahmen, D. (2019). Statistical field theory for neural networks. arXiv preprint arXiv:1901.10416.
- Hron et al. [2020] Hron, J., Bahri, Y., Sohl-Dickstein, J., and Novak, R. (2020). Infinite attention: Nngp and ntk for deep attention networks. In International Conference on Machine Learning, pages 4376–4386. PMLR.
- Jacot et al. [2018] Jacot, A., Gabriel, F., and Hongler, C. (2018). Neural Tangent Kernel: Convergence and Generalization in Neural Networks. arXiv e-prints, page arXiv:1806.07572.
- Lampinen and Ganguli [2018] Lampinen, A. K. and Ganguli, S. (2018). An analytic theory of generalization dynamics and transfer learning in deep linear networks. arXiv preprint arXiv:1809.10374.
- Lee et al. [2018] Lee, J., Sohl-dickstein, J., Pennington, J., Novak, R., Schoenholz, S., and Bahri, Y. (2018). Deep neural networks as gaussian processes. In International Conference on Learning Representations.
- Lee et al. [2019] Lee, J., Xiao, L., Schoenholz, S. S., Bahri, Y., Novak, R., Sohl-Dickstein, J., and Pennington, J. (2019). Wide neural networks of any depth evolve as linear models under gradient descent. arXiv preprint arXiv:1902.06720.
- Lee et al. [2020] Lee, J., Schoenholz, S. S., Pennington, J., Adlam, B., Xiao, L., Novak, R., and Sohl-Dickstein, J. (2020). Finite versus infinite neural networks: an empirical study. arXiv preprint arXiv:2007.15801.
- Li and Sompolinsky [2020] Li, Q. and Sompolinsky, H. (2020). Statistical mechanics of deep linear neural networks: The back-propagating renormalization group. arXiv preprint arXiv:2012.04030.
- Malach et al. [2021] Malach, E., Kamath, P., Abbe, E., and Srebro, N. (2021). Quantifying the benefit of using differentiable learning over tangent kernels. arXiv preprint arXiv:2103.01210.
- Mannelli et al. [2020] Mannelli, S. S., Vanden-Eijnden, E., and Zdeborová, L. (2020). Optimization and generalization of shallow neural networks with quadratic activation functions. arXiv preprint arXiv:2006.15459.
- Martin and Mahoney [2018] Martin, C. H. and Mahoney, M. W. (2018). Implicit Self-Regularization in Deep Neural Networks: Evidence from Random Matrix Theory and Implications for Learning. arXiv e-prints, page arXiv:1810.01075.
- Matthews et al. [2018] Matthews, A. G. d. G., Rowland, M., Hron, J., Turner, R. E., and Ghahramani, Z. (2018). Gaussian process behaviour in wide deep neural networks. arXiv preprint arXiv:1804.11271.
- Mccullagh [2017] Mccullagh, P. (2017). Tensor Methods in Statistics. Dover Books on Mathematics.
- Naveh et al. [2020] Naveh, G., Ben-David, O., Sompolinsky, H., and Ringel, Z. (2020). Predicting the outputs of finite networks trained with noisy gradients. arXiv preprint arXiv:2004.01190.
- Neal [1996] Neal, R. M. (1996). Priors for infinite networks. In Bayesian Learning for Neural Networks, pages 29–53. Springer.
- Note1 [????] Note1 (????). Generically this requires dependent and layer dependent weight decay.
- Note2 [????] Note2 (????). The shift is not part of the original model but has only a superficial shift effect useful for book-keeping later on.
- Novak et al. [2018] Novak, R., Xiao, L., Lee, J., Bahri, Y., Yang, G., Abolafia, D. A., Pennington, J., and Sohl-Dickstein, J. (2018). Bayesian Deep Convolutional Networks with Many Channels are Gaussian Processes. arXiv e-prints, page arXiv:1810.05148.
- Rasmussen and Williams [2005] Rasmussen, C. E. and Williams, C. K. I. (2005). Gaussian Processes for Machine Learning (Adaptive Computation and Machine Learning). The MIT Press.
- Refinetti et al. [2021] Refinetti, M., Goldt, S., Krzakala, F., and Zdeborová, L. (2021). Classifying high-dimensional gaussian mixtures: Where kernel methods fail and neural networks succeed. arXiv preprint arXiv:2102.11742.
- Saxe et al. [2013] Saxe, A. M., McClelland, J. L., and Ganguli, S. (2013). Exact solutions to the nonlinear dynamics of learning in deep linear neural networks. arXiv preprint arXiv:1312.6120.
- Sollich and Williams [2004] Sollich, P. and Williams, C. K. (2004). Understanding gaussian process regression using the equivalent kernel. In International Workshop on Deterministic and Statistical Methods in Machine Learning, pages 211–228. Springer.
- Yaida [2020] Yaida, S. (2020). Non-gaussian processes and neural networks at finite widths. In Mathematical and Scientific Machine Learning, pages 165–192. PMLR.
- Yang and Hu [2020] Yang, G. and Hu, E. J. (2020). Feature learning in infinite-width neural networks. arXiv preprint arXiv:2011.14522.
- Yosinski et al. [2014] Yosinski, J., Clune, J., Bengio, Y., and Lipson, H. (2014). How transferable are features in deep neural networks? In Z. Ghahramani, M. Welling, C. Cortes, N. Lawrence, and K. Q. Weinberger, editors, Advances in Neural Information Processing Systems, volume 27. Curran Associates, Inc.
- Yu et al. [2013] Yu, D., Seltzer, M., Li, J., Huang, J.-T., and Seide, F. (2013). Feature learning in deep neural networks - studies on speech recognition. In International Conference on Learning Representations.
- Zavatone-Veth and Pehlevan [2021] Zavatone-Veth, J. A. and Pehlevan, C. (2021). Exact priors of finite neural networks. arXiv preprint arXiv:2104.11734.
Appendix A Derivation of the target shift equations
A.1 The partition function in terms of dual variables
Consider the general setting of Bayesian inference with Gaussian measurement noise (or equivalently a DNN trained with MSE loss, weight decay, and white noise added to the gradients). Let denote the inputs and targets on the training set and let be the test point. Denote the prior (or equivalently the equilibrium distribution of a DNN trained with no data) by where is the output of the model, and . The model’s predictions (or equivalently the ensemble averaged DNN output) on the point can be obtained by
| (A.1) |
with the following partition function
| (A.2) |
where unless explicitly written otherwise, summations over run from to (i.e. include the test point). Here we commit to the MSE loss which facilitates the derivation, and in App. C we give an alternative derivation that may also be applied to other losses such as cross-entropy. Our goal in this appendix is to establish that the target shift equations are in fact saddle point equations of the partition function A.2 following some transformations on the variables of integration. To this end, consider the cumulant generating function of given by
| (A.3) |
or expressed via the cumulant tensors:
| (A.4) |
where the sum over the cumulant tensors does not include since our DNN priors are assumed to have zero mean. Notably one can re-express as the inverse Fourier transform of :
| (A.5) |
Plugging this in Eq. A.2 we obtain
| (A.6) |
where for clarity we do not keep track of multiplicative factors that have no effect on moments of . As the term in the exponent (the action) is quadratic in and linear in these can be integrated out to yield an equivalent partition function phrased solely in terms of :
| (A.7) |
where the action is now
| (A.8) |
The identification arises from the delta function:
| (A.9) |
Recall that and notice that the first term in Eq. A.8 (the cumulant generating function, ) depends on and not on whereas the rest of the action depends on and not on . Thus, for training points amounts to the average of , and so we identify
| (A.10) |
where denotes an expectation value using . We comment that the above relation holds also for any (non-mixed) cumulants of and except the covariance, where a constant difference appears due to the term in the action, namely
| (A.11) |
In the GP case the r.h.s. of Eq. A.11 would equal simply , since on the training set the posterior covariance of is the same as that of and for a GP takes the form
| (A.12) | ||||
namely and thus . The reader should not be alarmed by having a negative definite covariance matrix for , since cannot be understood as a standard real random variable as its partition function contains imaginary terms.
To make contact with GPs it is beneficial to expand in terms of its cumulants, and split the second cumulant, describing the DNNs’ NNGP kernel, from the rest. Namely, using Einstein summation
| (A.13) | ||||
Writing Eq. A.8 in this fashion gives the action:
| (A.14) |
A.2 Saddle point equation for the mean predictor
Having arrived at the action A.14, we can readily derive the saddle point equations for the training points by setting:
| (A.15) |
This corresponds to treating the variables as non-fluctuating quantities, i.e. replacing them with their mean value: . Performing this for the training set yields
| (A.16) |
where
| (A.17) |
where this target shift is related to of Eq. A.13 by
| (A.18) |
A.3 Posterior covariance
A.3.1 Posterior covariance on the test point
The posterior covariance on the test point is important for determining the average MSE loss on the test-set, as the latter involves the MSE of the mean-predictor plus the posterior covariance. Concretely, we wish to calculate , express it as an expectation value w.r.t and calculate this using with the self-consistent target shift. To this end, note that generally if then
| (A.20) |
For the action in Eq. A.14 we have
| (A.21) |
where an Einstein summation over is implicit. Further recalling that on the training set we have
| (A.22) | ||||
| (A.23) |
where here is the full quantity without any SP approximations
| (A.24) |
We obtain
| (A.25) |
where we can unpack the last two terms as
| (A.26) | ||||
One can verify that for the GP case where , Eq. A.25 simplifies to
| (A.27) |
which is the standard posterior covariance of a GP [35].
A.3.2 Posterior covariance on the training set
Our target shift approach at the saddle-point level allows a computation of the fluctuations of using the standard procedure of expanding the action at the saddle point to quadratic order in . Due to the saddle-point being an extremum this leads to and thus using the standard Gaussian integration formula, one finds that is the covariance matrix of . Performing such an expansion on the action of Eq. A.14 one finds
| (A.28) | ||||
where the on the r.h.s. are those of the saddle-point. Recalling Eq. A.11 we have
| (A.29) |
and the r.h.s. coincides with the posterior covariance of a GP with a kernel equal to .
A.4 A criterion for the saddle-point regime
Saddle point approximations are commonly used in statistics [11] and physics and often rely on having partition functions of the form where is a large number and is order (). In our settings we cannot simply extract such a large factor from the action and make it . Nonetheless, we argue that expanding the action to quadratic order around the saddle point is still a good approximation at large , with being the training set size. Concretely we give the following two consistency criteria based on comparing the saddle point results with their leading order beyond-saddle-point corrections. The first is given by the latter correction to the mean predictor over the scale of the saddle point prediction
| (A.30) |
where an Einstein summation over the training-set is implicit and the derivatives are evaluated at the saddle point value. This criterion can be calculated for any specific model to verify the appropriateness of the saddle point approach. We further provide a simpler criterion
| (A.31) |
which however relies on heuristic assumptions. The main purpose of this heuristic criterion is to provide a qualitative explanation for why we expect the first criterion to be small in many interesting large settings.
To this end we first obtain the leading (beyond quadratic) correction to the mean. Consider the partition function in terms of and its expansion around the saddle point. As is effectively bounded (by the Gaussian tails of the finite set of weights), the corresponding characteristic function () is well defined over the entire complex plane. Given this, one can deform the integration contour, along each dimension (), which originally laid on the real axis, to where is purely imaginary and equals so it crosses the saddle point (see also Ref. [11]). Next we expand the action in the deviation from the SP value: to obtain
| (A.32) |
where an Einstein summation over the training set is implicit and where we denoted for
| (A.33) |
Next we consider first order perturbation theory in the cubic term and calculate the correction to the mean of or equivalently .
| (A.34) | ||||
where here the kernel is shifted: , as in Eq. A.28 and means keeping terms in Wick’s theorem which connect the operator being averaged () with the perturbation, as standard in perturbation theory. Comparing the last term on the right hand side (i.e. the correction) with the predictions which are gives the first criterion, Eq. A.30. Depending on context, it may be more appropriate to compare this term with the discrepancy rather than the prediction.
Next we turn to study the scaling of this correction with . To this end we first consider a single derivative of (). Note that , by its definition, includes contributions from at least different ’s. In many cases, one expects that the value of this sum will be dominated by some finite fraction of the training set rather than by a vanishing fraction. This assumption is in fact implicit in our EK treatment where we replaced all with . Given so, the derivative , which can be viewed as the sensitivity to changing , is expected to go as one over the size of that fraction of the training set, namely as . Under this collectivity assumption we expect the scaling
| (A.35) |
Making a similar collectivity assumption on higher derivatives yields
| (A.36) |
Following this we count powers of in Eq. A.34 and find a contribution from the second derivative of and a contribution from the summation over . Despite containing two summations, we argue that the latter is in fact order . To this end consider for fixed , as an effective target function () where we multiplied by the scaling of the second derivative to make order 1. The above summation appears then as . Next we recall that , and so multiplication of a vector with can be interpreted as the discrepancy w.r.t. the target. Accordingly the above summation over can be viewed as performing GP Regression on leading to train discrepancy () which is order and hence order 1. The remaining summation has now a summand of the order and hence is or smaller. We thus find that the correction to the saddle point scales as
| (A.37) |
Generally we expect at strong over-parameterization (as non-linear effects are suppressed by ) and at good performances (as this implies good performance on the training set). Thus we generally expect and hence large controls the magnitude of the corrections. Considering the limit, we note in passing that typically remains finite. For instance it is simply for a Gaussian Process.
Considering the linear CNN model of the main text, we estimate the above heuristic criterion for and where and . This then gives as the small factor dominating the correction. As we choose in that experiment, we find that the correction is roughly . As the discrepancy is we expect roughly a relative error in predicting the discrepancy.
Appendix B Review of the Edgeworth expansion
In this section we give a review of the Edgeworth expansion, starting from the simplest case of a scalar valued RV and then moving on vector valued RVs so we can write down the expansion for the output of a generic neural network on a fixed set of inputs.
B.1 Edgeworth expansion for a scalar random variable
Consider scalar valued continuous iid RVs and assume WLOG , with higher cumulants for . Now consider their normalized sum . Recall that cumulants are additive, i.e. if are independent RVs then and that the -th cumulant is homogeneous of degree , i.e. if is any constant, then . Combining additivity and homogeneity of cumulants we have a relation between the cumulants of and
| (B.1) |
Now, let be the PDF of the standard normal distribution. The characteristic function of is given by the Fourier transform of its PDF and is expressed via its cumulants
| (B.2) |
where the last equality holds since and . From the CLT, we know that as . Taking the inverse Fourier transform has the effect of mapping thus
| (B.3) |
where is the th probabilist’s Hermite polynomial, defined by
| (B.4) |
e.g. .
B.2 Edgeworth expansion for a vector valued random variable
Consider now the analogous procedure for vector-valued RVs in (see [29]). We perform an Edgeworth expansion around a centered multivariate Gaussian distribution with covariance matrix
| (B.5) |
where is the matrix inverse of and Einstein summation is used. The ’th order cumulant becomes a tensor with indices, e.g. the analogue of is . The Hermite polynomials are now multi-variate polynomials, so that the first one is and the fourth one is
| (B.6) |
where the postscript bracket notation is simply a convenience to avoid listing explicitly all possible partitions of the indices, e.g.
In our context we are interested in even distributions where all odd cumulants vanish, so the Edgeworth expansion reads
| (B.7) |
B.3 Edgeworth expansion for the posterior of Bayesian neural network
Consider an on-data formulation, i.e. a distribution over a vector space - the NN output evaluated on the training set and on a single test point, rather than a distribution over the whole function space:
| (B.8) |
where is the test point. Let denote the th cumulant of the prior of the network over this space:
| (B.9) |
Take the baseline distribution to be Gaussian , around which we perform the Edgeworth expansion, thus the characteristic function of the prior reads
| (B.10) |
and thus
| (B.11) |
where we used the shorthand notation:
| (B.12) |
and the indices range over both the train set and the test point . In our case, all odd cumulants vanish, thus
| (B.13) |
Introducing the data term and a source term, the partition function reads (denote
| (B.14) |
Appendix C Target shift equations - alternative derivation
Here we derive our self-consistent target shift equations from a different approach which does not require the introduction of the integration variables by transforming to Fourier space. While this approach requires an additional assumption (see below) it also has the benefit of being extendable to any smooth loss function comprised of a sum over training points. In particular, below we derive it for both MSE loss and cross entropy loss.
To this end, we examine the Edgeworth expansion for the partition function given by Eq. B.14. By using a series of integration by parts and noting the boundary terms vanish, one can shift the action of the higher cumulants from the prior to the data dependent term
| (C.1) |
Doing so yields an equivalent viewpoint on the problem, wherein the Gaussian data term and the non-Gaussian prior appearing in Eq. B.14 are replaced in Eq. C.1 by a Gaussian prior and a non-Gaussian data term.
Next we argue that in the large limit, the non-Gaussian data-term can be expressed as a Gaussian-data term but on a shifted target. To this end we note that when is large, most combinations of derivatives in the exponents act on different data points. In such cases derivatives could simply be replaced as , where denotes the discrepancy on the training point .
Consider next how on a particular training point () is affect by these derivative terms. Following the above observation, most terms in the exponent will not act on and a portion will contain a single derivative. The remaining rarer cases, where two derivatives act on the same , are neglected. For each we thus replace derivatives in the order term in C.1 by discrepancies, leaving a single derivative operator that is multiplied by the following quantity
| (C.2) |
Note that the summation indices span only the training set, not the test point: , whereas the free index spans also the test point .
Recall that an exponentiated derivative operator acts as a shifting operator, e.g. for some constant , any smooth scalar function obeys . If this was a constant, the differential operator could now readily act on the data term. Next we make again our collectivity assumption: as involves a sum over many data-points, it will be a weakly fluctuating quantity in the large limit provided the contribution to comes from a collective effect rather than by a few data points. We thus perform our second approximation, of the mean-field type, and replace by its average , leading to
| (C.3) |
Given a fixed , C.3 is the partition function corresponding to a GP with the train targets shifted by and the test target shifted by . Following this we find that depends on the discrepancy of the GP prediction which in turn depends on . In other words we obtain our self-consistent equation: .
The partition function C.3 reflects the correspondence between finite DNNs and a GP with its target shifted by . To facilitate the analytic solution of this self-consistent equation, we focus on the case at least for . We note that this was the case for the two toy models we studied.
Given this, the expectation value over using the GP defined by , which consists of products of expectation values of individual discrepancies and correlations between two discrepancies, can then be expressed using only the former. Omitting correlations within the GP expectation value, one obtains a simplified self-consistent equation involving only the average discrepancies:
| (C.4) |
with now understood as a number, also within C.2. Lastly, we plug the solution to these equations to find the prediction on the test point: . These coincide with the self-consistent equations derived via the saddle point approximation in the main text.
Notably the above derivation did not hinge on having MSE loss. For any loss given as a sum over training points, , the above derivation should hold with in replaced by . In particular for the cross entropy loss where is the pre-softmax output of the DNN for class we will have
| (C.5) |
where and run over all classes, is the class of . Neatly, the above r.h.s. is again a form of discrepancy but this time in probability space. Namely it is , where is the distribution generated by the softmax layer, and is the empirical distribution. Following this one can readily derive self-consistent equations for cross entropy loss and solve them numerically. Further analytical progress hinges on developing analogous of the EK approximation for cross entropy loss.
Appendix D Review of the Equivalent Kernel (EK)
In this appendix we generally follow [35], see also [38] for more details. The posterior mean for GP regression
| (D.1) |
can be obtained as the function which minimizes the functional
| (D.2) |
where is the RKHS norm corresponding to kernel . Our goal is now to understand the behaviour of the minimizer of as . Let the data pairs be drawn from the probability measure . The expectation value of the MSE is
| (D.3) |
Let be the ground truth regression function to be learned. The variance around is denoted . Then writing we find that the MSE on the data target can be broken up into the MSE on the ground truth target plus variance due to the noise
| (D.4) |
Since the right term on the RHS of D.4 does not depend on we can ignore it when looking for the minimizer of the functional which is now replaced by
| (D.5) |
To proceed we project and on the eigenfunctions of the kernel with respect to which obey . Assuming that the kernel is non-degenerate so that the ’s form a complete orthonormal basis, for a sufficiently well behaved target we may write where , and similarly for . Thus the functional becomes
| (D.6) |
This is easily minimized by taking the derivative w.r.t. each to yield
| (D.7) |
In the limit we have thus we expect that would converge to . The rate of this convergence will depend on the smoothness of , the kernel and the measure . From D.7 we see that if then is effectively zero. This means that we cannot obtain information about the coefficients of eigenfunctions with small eigenvalues until we get a sufficient amount of data. Plugging the result D.7 into and recalling we find
| (D.8) |
The term it the equivalent kernel. Notice the similarity to the vector-valued equivalent kernel weight function where denotes the matrix of covariances between the training points with entries and is the vector of covariances with elements . The difference is that in the usual discrete formulation the prediction was obtained as a linear combination of a finite number of observations with weights given by while here we have instead a continuous integral.
Appendix E Additional technical details for solving the self consistent equations
E.1 EK limit for the CNN toy model
In this subsection we show how to arrive at Eq. 16 from the main text, which is a self consistent equation for the proportionality constant, , defined by . We first show that both the shift and the discrepancy are linear in the target, and then derive the equation.
E.1.1 The shift and the discrepancy are linear in the target
Recall that we assume a linear target with a single channel:
| (E.1) |
A useful relation in our context is
| (E.2) | ||||
The fact that is always a linear function of the input (since the CNN linear) and the fact that it is proportional to at (since the GP is linear in the target), motivates the ansatz:
| (E.3) |
Indeed we will show that this ansatz provides a solution to the non linear self consistent equations.
Notice that the target shift has a form of a geometric series. In the linear CNN toy model we are able to sum this entire series, whose first term is related to (using the notation introduced in §F):
| (E.4) | |||
For simplicity we can assume and , thus getting a simple proportionality constant of . If we were to trade for , as we have in , we would get a similar result, with an extra factor of . The factor of will cancel out with the factor of appearing in the definition of . Repeating this calculation for the sixth cumulant, one would arrive to the same result multiplied by a factor of due to the general form of the even cumulants (Eq. F.29) and the fact that there an extra two ’s.
E.1.2 Self consistent equation in the EK limit
Starting from the proportionality relations and , we can now write the self consistent equation for the discrepancy as
| (E.5) |
Dividing both sides by we get a scalar equation
| (E.6) | ||||
The factor can be calculated by noticing that has the form of a geometric series. To better understand what follows next, the reader should first go over §F. The first term in this series is related to contracting the fourth cumulant with three ’s thus yielding a factor of (recall that in the EK approximation we trade ). The ratio of two consecutive terms in this series is given by . Using the formula for the sum of a geometric series we have
| (E.7) |
E.2 Corrections to EK and estimation of the factor in the main text
The EK approximation can be improved systematically using the field-theory approach of Ref. [10] where the EK result is interpreted as the leading order contribution, in the large limit, to the average of the GP predictor over many data-set draws from the dataset measure. However, that work focused on the test performance whereas for we require the performance on the training set. We briefly describe the main augmentations needed here and give the sub-leading and sub-sub-leading corrections to the EK result on the training set, enabling us to estimate analytically within a relative error compared with the empirical value. Further systematic improvements are possible but are left for future work.
We thus consider the quantity where is drawn from the training set, is the predictive mean of the GP on that specific training set, and is some function which we will later take to be the target function (). We wish to calculate the average of this quantity over all training set draws of size . We begin by adding a source term of the form to the action and notice a similar term appearing in the GP action () due to the MSE loss. Examining this extra term one notices that it can be absorbed as a dependent shift to the target on training set () following which the analysis of Ref. [10] carries through straightforwardly. Doing so, the general result for the leading EK term and sub-leading correction are
| (E.8) |
where , means averaging with of Ref. [10], and is the EK prediction of the previous section, Eq. D.8.
Turning to the specific linear CNN toy model and carrying the above expansion up to an additional term leads to
| (E.9) | ||||
Considering for instance and , we find and so
| (E.10) |
recalling that we have
| (E.11) |
whereas the empirical value here is .
Appendix F Cumulants for a two-layer linear CNN
In this section we explicitly derive the leading (fourth and sixth) cumulants of the toy model of §IV.1, and arrive at the general formula for the even cumulant of arbitrary order.
F.1 Fourth cumulant
F.1.1 Fourth cumulant for a CNN with general activation function (averaging over the readout layer)
For a general activation, we have in our setting for a 2-layer CNN
| (F.1) |
The kernel is
| (F.2) | ||||
The fourth moment is
| (F.3) |
Averaging over the last layer weights gives
| (F.4) |
So this will always make two pairs out of four ’s, each with the same indices. Notice that, regardless of the input indices, for different channels we have
| (F.5) |
so, e.g. the first term out of three is
| (F.6) | |||
| (F.9) |
where in the last line we separated the diagonal and off-diagonal terms in the channel indices. So
| (F.10) | |||
| (F.13) |
On the other hand
| (F.14) | |||
| (F.17) |
Putting it all together, the off-diagonal terms in the channel indices cancel and we are left with
| (F.18) | |||
where in the last line we introduced a short-hand notation to compactly keep track of the combinations of the indices.
F.1.2 Fourth cumulant for linear CNN
Here, . The fourth moment is
| (F.19) | |||
Similarly
| (F.20) | ||||
Notice that the 2nd and 3rd terms have while the first term has . The latter will cancel out with the terms. Thus
| (F.21) | |||
Denote The fourth cumulant is
| (F.22) | ||||
Notice that all terms involve inner products between ’s with different indices , i.e. mixing different convolutional windows. This means that , and also all higher order cumulants, cannot be written in terms of the linear kernel, which does not mix different conv-window indices. This is in contrast to the kernel (second cumulant) of this linear CNN which is identical to that of a corresponding linear fully connected network (FCN): It is also in contrast to the higher cumulants of the corresponding linear FCN, where all cumulants can be expressed in terms of products of the linear kernel.
F.2 Sixth cumulant and above
The even moments in terms of cumulants for a vector valued RV with zero odd moments and cumulants are (see [29]):
| (F.23) | ||||
where the moments are on the l.h.s. (indices with no commas) and the cumulants are on the r.h.s. (indices are separated with commas). Thus, the sixth cumulant is
| (F.24) |
In the linear case, the analogue of is ( such pairings, where only the numbers "move", not the )
| (F.25) |
and the analogue of is
| (F.26) | |||
Below, we found the 6th moment for a linear CNN to be
| (F.27) | |||
Notice that for every blue term we have exactly red terms, so all of the colored terms will exactly cancel out and only the uncolored terms will survive. There are such uncolored terms for each one of the pairings, thus we will ultimately have such pairs, thus the sixth cumulant is
| (F.28) |
where the stands for the number of ways to pair the numbers into the form .
We can thus identify a pattern which we conjecture to hold for any even cumulant of arbitrary order :
| (F.29) |
where the indices obey the following:
-
1.
Each index appears exactly twice in each summand.
-
2.
Each index cannot be paired with itself, i.e. is not allowed.
-
3.
The same pairing can appear more than once, e.g. is OK, in that are paired together twice, and so are .
Appendix G Feature learning phase transition
G.1 Field theory derivation of the statistics of the hidden weights covariance
Although our main focus was on the statistics of the DNN outputs, our function-space formalism can also be used to characterize the statistics of the weights of the intermediate hidden layers. Here we focus on the linear CNN toy model given in the main text, where the learnable parameters of the student are given by . Consider first a prior distribution in output space, where throughout this section we denote: , i.e. the vector of outputs on the training set alone (without the test point). Since we are interested in the statistics of the hidden weights, we will introduce an appropriate source term in weight space
| (G.1) |
where is the of output of the CNN parameterized by on the ’th training point. Given some loss function , the posterior is given by
| (G.2) |
The posterior mean of the hidden weights is thus
| (G.3) |
and the posterior covariance can be extracted from taking the second derivative, namely
| (G.4) | ||||
Our next task is to rewrite these expectation values over weights under the posterior as expectation values of DNN training outputs () under the posterior. To this end we write down the kernel of this simple CNN such that it depends on the source terms:
| (G.5) | ||||
where . This can be written as ()
| (G.6) |
We can now write the second mixed derivatives of to leading order in as
| (G.7) | ||||
Next we take the large limit and thus have a posterior of the form where contains only and none of the higher cumulants. Having the derivatives of w.r.t. we can proceed in analyzing the derivatives of the log-partition function for the posterior w.r.t . In particular the covariance matrix of the weights averaged over the different channels is
| (G.8) | |||
The above result is one of the two main points of this appendix: we established a mapping between expectation values over outputs and expectation values over hidden weights. Such a mapping can in principle be extended to any DNN. On the technical level, it requires the ability to calculate the cumulants as a function of the source terms, . As we argue below, it may very well be that unlike in the main text, only a few cumulants are needed here.
To estimate the above expectation values we use the EK limit, where the sums over the training set are replaced by integrals over the measure , the ’s are replaced as and we assume the input distribution is normalized as . Following this we find
| (G.9) | |||
Comparing this to our earlier result for the covariance Eq. G.4 we get
| (G.10) | ||||
Multiplying by and recalling that we get
| (G.11) |
Repeating similar steps while also taking into account diagonal fluctuations yields another factor of on the diagonal, thus arriving at the result as it appears in the main text:
| (G.12) |
The above results capture the leading order correction in to the weights covariance matrix. However the careful reader may be wary of the fact that the results in the main text require corrections to all orders and so it is potentially inadequate to use such a low order expansion deep in the feature learning regime, as we do in the main text. Here we note that not all DNN quantities need to have the same dependence on . In particular it was shown in Ref. [24], that the weight’s low order statistics is only weakly affected by finite-width corrections whereas the output covariance matrix is strongly affected by these. We conjecture that this is the case here and that only the cumulative effect of many weights, as reflected in the output of the DNN, requires strong corrections.
This conjecture can be verified analytically by repeating the above procedure on the full prior (i.e. the one that contains all cumulants), obtaining the operator in terms of ’s corresponding the weight’s covariance matrix, and calculating its average with respect to the saddle point theory. We leave this for future work.
G.2 A surrogate quantity for the outlier
Since we used moderate values in our simulations (to maintain a reasonable compute time), we aggregated the eigenvalues of many instances of across training time and across noise realizations. Although the empirical histogram of the spectrum of agrees very well with the theoretical MP distribution (solid smooth curves in Fig. 2A), there is a substantial difference between the two at the right edge of the support , where the empirical histogram has a tail due to finite size effects. Thus it is hard to characterize the phase transition using the largest eigenvalue averaged across realizations. Instead, we use the quantity as a surrogate which coincides with for but behaves sensibly on both sides of , thus allowing to characterize the phase transition.
Appendix H Further details on the numerical experiments
H.1 Additional details of the numerical experiments
In our experiments, we used the following hyper-parameter values. Learning rates of which yield results with no appreciable difference in almost all cases, when we scale the amount of statistics collected (training epochs after reaching equilibrium) so that both values have the same amount of re-scaled training time: we used training seeds for and 30 for . We used a gradient noise level of , but also checked for and got qualitatively similar results to those reported in the main text.
(A)
 (B)
(B)

In the main text and here we do not show error bars for as these are too small to be appreciated visually. They are smaller than the mean values by approximately two orders of magnitude. The error bars were found by computing the empirical standard deviation of across training dynamics and training seeds.
H.2 Convergence of the training protocol to GP
In Fig. 4 we plot the MSE between the outputs of the trained CNNs and the predictions of the corresponding GP. We see that as becomes large the slope of the MSE tends to indicating the scaling of the leading corrections to the GP. This illustrates where we enter the perturbative regime of GP, and we see that this happens for larger as we increase the conv-kernel size , since this also increases the input dimension . Thus it takes larger to enter the highly over-parameterized regime.

Appendix I Quadratic fully connected network
One of the simplest settings where GPs are expected to strongly under-perform finite DNNs is the case of quadratic fully connected DNNs [26]. Here we consider some positive target of the form where and a student DNN given by 222The shift is not part of the original model but has only a superficial shift effect useful for book-keeping later on.
At large and for drawn from , the student generates a GP prior. It is shown below that the GP kernel is simply . As such it is proportional to the kernel of the above DNN with an additional linear read-out layer. The above model can be written as where is a positive semi-definite matrix. The eigenvalues of the matrix appearing within the brackets are therefore larger than whereas no similar restriction occurs for DNNs with a linear read-out layer. This extra restriction is completely missed by the GP approximation and, as discussed in Ref. [26], leads to strong performance improvements compared to what one expects from the GP or equivalently the DNN with the linear readout layer. Here we demonstrate that our self-consistent approach at the saddle-point level captures this effects
We consider training this DNN on train points using noisy GD training with weight decay . We wish to solve for the predictions of this model with our shifted target approach. To this end, we first derive the cumulants associated with the effective Bayesian prior () here. Equivalently stated, obtain the cumulants of the equilibrium distribution of following training with no data, only a weight decay term. This latter distribution is given by
| (I.1) |
To obtain the cumulants, we calculate the cumulant generating function of this distribution given by
| (I.2) | |||
Taylor expanding this last expression is straightforward. For instance up to third order is gives
| (I.3) | ||||
from which the cumulants can be directly inferred, in particular the associated GP kernel given by
| (I.4) |
Following this, the target shift equation, at the saddle point level, becomes
| (I.5) | ||||
The above non-linear equation for the quantities could be solved numerically, with the most numerically demanding part being the inverse of on the training set.

Figure 5 shows the numerical results for the test MSE as obtained by solving the above equations for on the training set, taking in these equation together with the self-consistent to find the mean-predictor, and taking the average MSE of the latter over the test set. Both test and train data sets were random points sampled uniformly from a dimensional hypersphere of radius one. The test dataset contained points and the figure shows the test MSE as a function of where , , , , and drawn from . The non-linear equations were solved using the Newton-Krylov algorithm together with gradual annealing from down to the above values. The figure shows the median over data sets. Remarkably, our self-consistent approach yields the expected threshold values of [26] separating good and poor performance. Discerning whether this is a threshold or a smooth cross-over in the large limit is left for future work.
Turning to analytics, one can again employ the EK approximation as done for the CNN. However taking to zero invalidates the EK approximation and requires a more advance treatment as in Ref. [10]. We thus leave an EK type analysis of the self-consistent equation at for future work and instead focus on the simpler case of finite where analytical predictions can again be derived in similar fashion to our treatment of the CNN.
To simplify things further, we also commit to the distribution . In this setting has two distinct eigenvalues w.r.t. to this measure, the larger one () associated with and a smaller one () associated with (with ) and (with ) eigenfunctions.
Next we argue that provided the discrepancy is of the following form
| (I.6) |
then within the EK limit the target shift is also of the form of the r.h.s. with and and the target shift equations reduce to two coupled non-linear equations for and . Following the EK approximation, we replace all in the target shift equation with and obtain
| (I.7) |
Next we note that the element of the matrix is given by
| (I.8) |
whereas for we obtain
| (I.9) | ||||
taking this together with the simpler term ()
| (I.10) |
Consider the matrix , appearing in the above denominator with , and note that
| (I.11) |
Plugging this equation into a Taylor expansion of the denominator of Eq. I.10 one finds that all the resulting terms are of the desired form of a linear superposition of and . Considering the first term on the r.h.s. of Eq. I.10, is already an eigenfunction of the kernel whereas can be re-written as
| (I.12) | ||||
so that the first two terms on the r.h.s. are eigenfunctions and the last one is a eigenfunctions. Summing these different contributions along with the aforementioned Taylor expansion, one finds that is indeed a linear superposition of and .
Next we wish to write down the saddle-point equations for and . For simplicity we focus on the case where is chosen orthogonal to under , namely . Under this choice the self-consistent equations become
| (I.13) | ||||
where the constant was defined above and .
Next we perform several straightforward algebraic manipulations with the aim of extracting their asymptotic behavior at large . Noting that , , and we have
| (I.14) | ||||
Further simplifications yield
| (I.15) | ||||
noting that we find
| (I.16) | ||||
The first equation above is linear in and yields in the large limit
| (I.17) |
It can also be used to show that
| (I.18) |
which when placed in the second equation yields
| (I.19) |
At large , we expect and to go to zero. Accordingly to find the asymptotic decay to zero, one can approximate , and similarly . This along with the large limit simplifies the equations to a quadratic equation in
| (I.20) |
which for simplifies further into
| (I.21) |
yielding
| (I.22) | ||||
| (I.23) |
We thus find that both and are of the order of . Hence scaling as ensures good performance. This could have been anticipated as for small yet finite each can be seen as a soft constrained on the parameters of the DNN and since the DNN contains parameters should provide enough data to fix the student’s parameters close to the teacher’s.