A mapping of [C ii], [O i] and [O iii] lines from the circumnuclear region of M31
Abstract
The circumnuclear region of M31, consisting of multiphase interstellar medium, provides a close-up view of the interaction of the central supermassive black hole and surrounding materials. Far-infrared (FIR) fine structure lines and their flux ratios can be used as diagnostics of physical properties of the neutral gas in this region. Here we present the first FIR spectroscopic mapping of the circumnuclear region of M31 in [C ii] 158, [O i] 63 and [O iii] 88 lines with the , covering a pc (2) field. Significant emissions of all three lines are detected along the so-called nuclear spiral across the central kpc of M31. The velocity field under a spatial resolution of 50 pc of the three lines are in broad consistency and also consistent with previous CO(3–2) line observations in the central region. Combined with existing [C ii] and CO(3–2) observations of five other fields targeting on the disk, we derived the radial distribution of [C ii]/CO(3–2) flux ratio, and found that this ratio is higher in the center than the disk, indicating a low gas density and strong radiation field in the central region. We also found that the [C ii]/FIR ratio in the central region is 5.4 ( 0.8) 10-3, which exhibits an increasing trend with the galactocentric radius, suggesting an increasing contribution from old stellar population to dust heating towards the center.
1 Introduction
Galactic circumnuclear regions, in which the multiphase interstellar medium (ISM) and various stellar populations are actively interacting with the supermassive black holes (SMBHs), are crucial to our understanding of the accretion and feedback of SMBHs, and in turn the global evolution of the host galaxies.
As the closest external spiral galaxy, the Andromeda galaxy (M31) gives us a unique opportunity to study the circumnuclear environment in a close-up view, thanks to its proximity (D 785 kpc, where 1 = 3.8 pc, McConnachie et al., 2005), appropriate inclination () and low line-of-sight extinction ( 1, Dong et al., 2016).
The most conspicuous structure of this environment is the so-called nuclear spiral, which consists of spiral-like filaments across the central few hundred parsecs of M31. Both optical emission (Jacoby, Ford & Ciardullo, 1985) and extinction (Dong et al., 2016), and infrared (IR) emission (Li et al., 2009) from the nuclear spiral indicate that it is composed of neutral, dusty gas clouds with ionized outer layers. The investigation of dust (Draine et al., 2014) and molecular gas (e.g. Melchior & Combes, 2013; Li et al., 2019, 2020) has revealed that the kinetic temperature is higher in the nucleus than in the disk.
However, the ionization/excitation mechanism of the nuclear spiral remains a long-standing puzzle, given the weak nuclear activity (Li et al., 2011) and the absence of on-going star formation (Brown et al., 1998; Groves et al., 2012; Dong et al., 2015) in this region.
Far infrared (FIR) atomic/ionic fine-structure lines, such as [C ii] 158, [O i] 63 and [O iii] 88, arise from multiple ISM phases, and thus can be used as diagnostics of the physical conditions of the circumnuclear environment.
Specifically, due to the moderate ionization potential of carbon (11.26 eV), [C ii] 158 line is present in low-density diffuse ionized gas, neutral photodissociation regions (PDRs) and also diffuse molecular clouds (Petuchowski et al., 1993; Heiles, 1994; Abel, 2006). On the other hand, [O i] 63 line is only found in neutral gas (PDRs and molecular clouds) since its ionization potential is 13.62 eV, very close to that of hydrogen; while [O iii] 88 is exclusively found in ionized gas because the production of O++ requires energetic photons (35.12 eV).
These lines are also widely used as star formation rate (SFR) tracers (e.g. De Looze et al., 2014) since they are from the ISM that fuels and closely interacts with star formation. Among them, [C ii] 158 is most often investigated since it is typically the most luminous line in galaxies (e.g., Stacey et al., 1991). The relationship of SFR surface density and [C ii] intensity has been extensively investigated in nearby galaxies (Herrera-Camus et al., 2015), such as M51 (Pineda et al., 2018), and also in M31 disk (Kapala et al., 2015). These studies all found tight correlations between the two quantities. However, since the circumnuclear region of M31 is lack of current star formation (e.g. Dong et al., 2015), we will not further discuss this correlation in this paper.
Moreover, [C ii] 158 usually acts as the main coolant for low density neutral gas (the bulk of neutral gas) due to its lower excitation energies and critical densities ( 91 K and 3 cm-3), while [O i] 63 is dominant in high density and temperature regime ( 228 K; 8.5105 cm-3). The neutral ISM is mainly heated by photoelectrons ejected by dust grains absorbing far-ultraviolet (FUV) photons within the range 6-13.6 eV (Draine et al., 1978). The energy of the heated ISM is later taken away by collisional excited FIR emission lines, and the gas is thus cooled. On the other hand, the dust grains can be heated by photons of nearly all energies (mostly 0.01-13.6 eV) and then re-radiated in total infrared (TIR, 8-1000 ; Sanders & Mirabel, 1996) band. Thus, the [C ii]/TIR ratio can be an approximation of the theoretical photoelectric heating efficiency, , defined as the photoelectric heating rate divided by the dust grain photon absorption rate (Tielens & Hollenbach, 1985).
Investigations of these lines could give us insights about the physical properties of the ISM, in particular the M31 center.
The first [C ii] 158 observations of M31 (Mochizuki, 2000) was made with the Infrared Space Observatory (; Kessler et al., 1996), resulting in a strip map of 31 positions with a spatial resolution of 70. Mochizuki (2000) detected [C ii] flux in the central region at the level of 1 erg s-1 cm-2 sr-1 and found a [C ii]/100 flux ratio of 6, higher than that found in the Milky Way, which the author interpreted as due to the higher gas column density of the Galactic center.
More recent observations (Kapala et al., 2015) carried out with Herschel Space Observatory (Pilbratt et al., 2010) targeting five regions in M31 disk have mapped the [C ii] lines with much higher resolution (12) and found the [C ii]/TIR ratio increases with radius.
Using the same set of data, Kapala et al. (2017) later claimed that since TIR emission involves the contribution from all photons that can heat dust, not just the FUV photons capable of ejecting photoelectrons, the [C ii]/FUVatt ratio could be a better proxy of , where FUVatt stands for the attenuated FUV emission.
The circumnuclear region of M31 is a relatively small reservoir of neutral gas. To date, there is no unambiguous detection of circumnuclear atomic hydrogen reported. An upper limit of M⊙ was placed on the HI mass in the central 500 pc (Brinks, 1984), and a more recent survey by Braun et al. (2009) yielded no substantial detection in the central kpc. Only until recently, molecular gas has been mapped in this region with sensitive IRAM 30m CO(2–1) (Melchior & Combes, 2013) and JCMT CO(3–2) observations (Li et al., 2019), which suggest a small amount of molecular gas ( M⊙).
In this work we present spectroscopic observations of the [C ii] 158 , [O i] 63 and [O iii] 88 lines in the central 2 arcmin of M31, which is the first mapping of atomic phase gas in this region with a resolution comparable to molecular gas and dust observations. We make maps and analyze the flux ratios of these lines to study the ISM properties of the nuclear spiral and compare the results with that of the disk.
The paper is organized as follows. The observations and data preparation are described in Section 2. The results are presented in Section 3, including the morphology and kinematics of the lines, and the analysis of their ratios. The discussion and implication of the results are presented in Section 4. A brief summary is given in Section 5.
2 Observations and data preparation
The observations of [C ii] 158, [O i] 63 and [O iii] 88 lines were carried out during 2012-6-19 and 2012-6-20 for a total time of 9.9 hours (obsid: 1342247148, 1342247149; PI: Z. Li) with . The data were obtained with Photodetector Array Camera and Spectrometer (PACS; Poglitsch et al., 2010) using the 3 3 raster mode covering a 120 ( pc) area of M31 nuclear spiral. This field is centering on ([RA,DEC]=[10.691149, 41.275203]), 100 pc northeast of the M31 center ([RA,DEC]=[10.684793, 41.269065]). We adopted the unchopped grating scan mode, with an off-source field chosen at an inter-arm region northwest of the M31 nucleus. The wavelength, angular and velocity resolution of these lines are given in Table 2.
The data were reduced using the Herschel Interactive Processing Environment (HIPE, Ott, 2010) version 14.0 standard pipeline (SPG 14). We made use of the level 2 data from the Herschel Science Archive (HSA), which are fully reduced and flux calibrated. We then applied the script provided by named “FittingPacsCubes_mappingI.py”, which is suitable for PACS spectroscopy data cube analysis, to process the data and fit the spectra. The main steps are summarized below.
We started with the interpolated cube with a pixel size of 3 since it not only satisfies the Nyquist sampling requirement for all three lines but also is smoother than the recommended projected cube. First, we cropped the noisy end of the spectra to avoid contamination from the spectral edges. Next, we used a first-order polynomial (second-order for the [O i] spectrum, since the signal is relatively weak and the baseline is not as stable as the other two lines) plus a Gaussian to fit each spectrum, and obtained the peak, center and width of the line. We then eliminated the spaxels with peak signal-to-noise ratio (SNR) smaller than 3 and obtained the integrated intensity and velocity maps of all three lines using the masked cube. For comparison of CO(3–2) and [C ii] emission, we smoothed them to a common spatial resolution and regridded them to a pixel size of 15. The flux is converted to erg s-1 cm-2 sr-1, and the velocity reference frame is Local Standard of Rest (LSR). Throughout this paper, we adopt a systemic velocity of M31 of -300 km s-1 (van den Bergh, 1969), a position angle of 38∘ and an inclination angle of 77∘ for the M31 disk (McConnachie et al., 2005), and an inclination angle of 45∘ for the central 1 kpc (Ciardullo et al., 1988).

We retrieved several ancillary data sets to assist our analysis: (1) The CO(3–2) map of the central kpc of M31 obtained from the James Clerk Maxwell Telescope (JCMT) with HARP raster mode (Li et al., 2019), taken with a resolution of 15 and a typical RMS of 3.5 mK in a 13 km s-1 channel. (2) PACS imaging in [C ii] 158 and optical integral-field spectroscopy of five fields in M31 disk from the Survey of Lines In M31 (SLIM, Kapala et al., 2015). These fields are reduced in the same way as described above. (3) The CO(3–2) observations of the five SLIM fields from a JCMT large program HARP and SCUBA-2 High-Resolution Terahertz Andromeda Galaxy Survey (HASHTAG; Li et al., 2020, M. Smith et al. in preparation). (4) Galaxy Evolution Explorer (GALEX) FUV (1350-1750 Å) map of M31 (Thilker et al., 2005). (5) The dust mass surface density map of the whole galaxy (Draine et al., 2014), obtained with spectral energy distribution (SED) fitting of infrared emission. (6) Total far infrared (FIR) luminosity map from Ford et al. (2013), which was produced by integrating over six frequency bands, including MIPS 70 , PACS and SPIRE 100, 160, 250, 350, 500 . The footprint of the five SLIM fields as well as the Nucleus field are shown in Figure 1.


| Species | Rest wavelength | Velocity resolution(a)(a)footnotemark: | Angular resolution | Flux(b)(b)footnotemark: |
|---|---|---|---|---|
| () | (km s-1) | () | (10-5 erg s-1 cm-1 sr-1) | |
| [O i] | 63.18 | 98 | 9 | 1.06 0.26 |
| 88.36 | 121 | 9 | 1.85 0.17 | |
| 157.74 | 239 | 11 | 2.03 0.08 |
Note. — (a) The velocity and angular resolution are from PACS observers’ manual 2010 (http://herschel.esac.esa.int/Docs/PACS/pdf/pacs_om.pdf). (b) The average intensity of the lines measured within the red rectangle in Figure 2. The error represents the typical intensity error of each spaxel.
3 Results
3.1 Morphology and kinematics
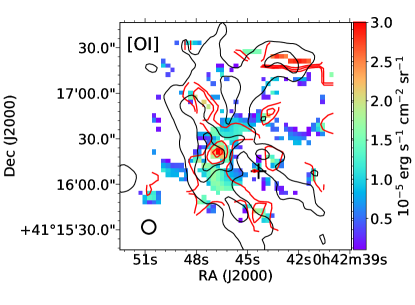
The integrated intensity and velocity maps of the three lines are shown in Figure 2. As shown in the upper left panel, the [C ii] integrated intensity (color map) is in broad consistency with the CO(3-2) emission (contours) in the southern half of the nuclear spiral, while CO(3–2) is almost absent in the northern half, which is mainly due to the weak CO(3–2) emission in this region (Li et al., 2019). [O i] line is weak compared to the other two lines. Though the emission seems patchy due to the low SNR, there are still detections in the nuclear spiral region, and the morphology is roughly consistent with the dust emission. The [O iii] emission has fibrous structure and broadly matches with the H emission (Devereux et al., 1994), which is obtained with the Case Western Burrell Schmidt telescope at Kitt Peak National Observatory. The line-of-sight velocity fields of the three lines are shown in the right panels of Figure 2. The velocity patterns are similar, all indicating that the nuclear spiral structure is redshifted for 200 km s-1 with respect to M31’s systemic velocity, consistent with the CO(3–2) velocity obtained with JCMT (Li et al., 2019).
Averaged spectra of the the CO(3–2) and [C ii] lines are shown in Figure 3 left panel, and that of [O i] and [O iii] lines are shown in the right panel. To ensure a sufficient SNR, we only included the spaxels in the red rectangle shown in Figure 2, where the emission is strong for all the four lines. The average flux of each line measured within the rectangle is listed in Table 2. For the weak [O i] line, we further derived a 3 upper limit, , over spaxels with SNR 3 throughout the map. After Gaussian fitting and deconvolution, we found the CO(3–2) and [C ii] line are consistent in central velocity (150 km s-1) and velocity dispersion ( 120 km s-1). The central velocity of the [O i] and [O iii] lines are also consistent with each other, while the [O iii] line is broader than [O i] by 30 km s-1. The relatively large difference in the velocity dispersion is mainly caused by the excess in the [O iii] line at around 270 km s-1, which is unseen in [O i]. Since we averaged spectra from the same region (the red rectangle in Figure 2), this excess could be an ionized gas component along the line-of-sight that is not traced by [O i]. Under a relatively high velocity resolution, the [O i] line exhibits two velocity components, centering at 190 km s-1 and 80 km s-1, respectively. This is best understood as the [O i] line arising from two different arms of the nuclear spiral, as shown in the extinction map obtained with multi-band HST observations (Dong et al., 2016, Figure 3 therein).
3.2 Flux ratios


[C ii] is the dominant coolant of neutral gas, which is mainly heated by UV photons with energy range 6-13.6 eV (equivalent to 912-2067Å). On the other hand, CO is mainly formed in dense H2 gas and shielded by dust grains, which can be photodissociated by absorbing photons near 1000 Å. Clouds with higher metallicity and gas density will be able to shield the CO molecule more efficiently and thus enhance the CO emission. Meanwhile, FUV photons can both increase [C ii] and decrease CO emission. As a result, the [C ii]/CO(3–2) flux ratio varies with metallicity, gas density, and FUV flux (e.g. Rollig et al., 2006).
Combining the [C ii] (Kapala et al., 2015) and CO(3–2) (Li et al., 2020) data of the five SLIM field, we derived the pixel-by-pixel radial distribution of the [C ii]/CO(3–2) ratio, as shown in the Figure 4(a). For pixels with detection of only one line, we calculated the 3 upper limit of another line and then derived the upper or lower limit of the [C ii]/CO(3–2) ratio. We computed the mean ratio including both upper and lower limits, using the software Astronomy SURVival Analysis (ASURV; Lavalley & Feigelson, 1992). According to the KOSMA- PDR model (Strzer et al., 1996)111https://hera.ph1.uni-koeln.de/pdr/, which solves the chemistry and radiative transfer in PDR region with spherical geometry, [C ii]/CO flux ratio decreases for increasing metallicity and gas density (Rollig et al., 2006). Since the metallicity of M31 decreases with increasing galactocentric radius (Draine et al., 2014), the high ratio in the center cannot be attributed to metallicity.
We thus compared the [C ii]/CO(3–2) ratio with the dust mass surface density map from Draine et al. (2014), as shown in Figure 4(b). To evaluate the significance of this correlation, we calculated the Spearman’s rank coefficient using only the pixels with both detections. The resultant = -0.45, with a p-value (the probability under the null hypothesis of random variables) 0.001. The negative correlation indicates that, in general, higher ratio indeed corresponds to lower gas surface density, if assuming a constant gas-to-dust ratio. We note that the gas-to-dust ratio may be lower in the central region (Li et al., 2019), which will even strengthen our conclusion. As a result, the high [C ii]/CO ratio in the center indicates low gas density in this region, consistent with previous studies (Li et al., 2009; Dong et al., 2016; Li et al., 2019).
We then analyzed the correlation between FUV flux and [C ii]/CO(3–2) ratio. The FUV emission from the M31 center is most likely to arise from old stellar populations (Brown et al., 1998; Dong et al., 2015; Viaene et al., 2017), while the SED fitting method adopted by Kapala et al. (2017) to derive the attenuated FUV flux is based on the young Galactic disk stellar population. Hence this method is not suitable for the central region. We thus simply used the GALEX FUV flux of each field, and found it positively correlated with the ratio, as indicated in Figure 4(c), with Spearman’s rank coefficient = 0.39 (p 0.001). This correlation suggests that the strong FUV radiation in the center is at least partly responsible for the high ratio.


We examined the [C ii]/[O iii] flux ratio, and found it ranges from 0.2 to 4.6 along the nuclear spiral, with an average value of 1. The [C ii]/[O i] flux ratio ranges from 0.5 to 11.6 (with only 7% pixels 1) and has a mean value of 2.1 in the nuclear spiral region, similar to that found in the disk fields (2.2, Kapala et al., 2015), which indicates [C ii] is indeed the dominant coolant of neutral gas here. As a result, the [C ii]/FIR ratio can be considered as an approximation of the photoelectric heating efficiency. Previous studies found this ratio in the range of 0.1 (Bakes & Tielens, 1994; Weingartner & Draine, 2001), and varies dramatically in different environments. Kapala et al. (2015) found that the [C ii]/TIR ratio increases with galactocentric radius using the measurements of the five SLIM fields in the disk of M31.
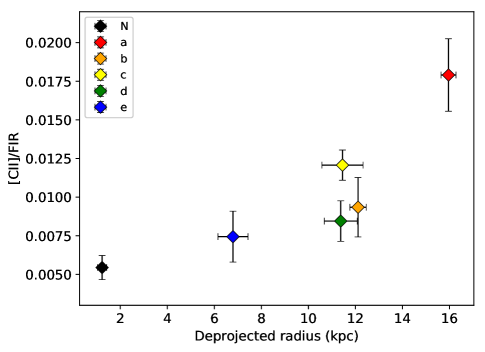
We measured the [C ii]/FIR ratio of the central region and the five fields in the disk (Kapala et al., 2015). The FIR map is from Ford et al. (2013), and the [C ii] map was convolved to a resolution of 36 to match the resolution of the FIR map. The ratios are calculated using the mean intensities in each field, as shown in Figure 5. The average [C ii]/FIR ratio is 5.4 ( 0.8) 10-3 in the central region, in good agreement with the [C ii]/100 ratio derived in Mochizuki (2000), which is 6 10-3. We found that the increasing trend still holds after adding the Nucleus field, as shown in Figure 5 left panel. Kapala et al. (2017) claimed that the increasing trend of [C ii]/TIR ratio with radius may be due to the contribution from old stellar population to dust heating increasing towards the center. Consequently, the infrared emission from dust increases, while the gas is not heated efficiently by the less energetic photons from old stellar populations, consistent with previous findings (e.g. Dong et al., 2015; Viaene et al., 2017).

Previous studies have found a “deficit” of the [C ii]/FIR ratio at high FIR luminosity (e.g. Malhotra et al., 1997; Stacey et al., 2010) and high 60 /100 continuum flux ratio (F60/F100, a proxy for dust temperature; e.g. Malhotra et al., 2001). Possible reasons for this deficit include inefficient photoelectron ejection of dust grains, due to an increase in grain charge (Malhotra et al., 2001; Croxall et al., 2012) and/or low polycyclic aromatic hydrocarbons fraction (Helou et al., 2001), and [C ii] saturation at high luminosity (while the FIR increases linearly with FUV radiation; Gullberg et al., 2015). To investigate this deficit in M31, we calculated the mean F60/F100 ratio of each field using the Infrared Astronomical Satellite (IRAS) 60 and 100 flux. For comparison, we made use of the Brauher et al. (2008) sample, one of the most complete extragalactic FIR emission line samples, observed by the , which contains all morphologies of galaxies. We only used the unresolved galaxy sample. For them, we obtained the FIR flux using the IRAS 60 and 100 flux given in Brauher et al. (2008) and the formula from Helou et al. (1988). The plot of [C ii]/FIR ratio and F60/F100 are shown in Figure 5 right panel, in which a declining trend is evident. The five SLIM fields of M31 disk fall in the high [C ii]/FIR, low F60/F100 regime, showing no obvious deficit, consistent with the overall quiescent and cold environment. The Nucleus field, on the other hand, with a significantly higher dust temperature than the disk (Draine et al., 2014), exhibits a lower [C ii]/FIR ratio.
4 Discussion
The fraction of [C ii] coming from ionized gas can affect our discussions above. This fraction is less than 50% in the five SLIM fields, according to the estimation of Kapala et al. (2015), with a typical value of 20%. We note that in the central region, due to higher FUV intensity and dust temperature (Draine et al., 2014), the fraction could be higher (Croxall et al., 2012). However, the [C ii] emission from different components is hard to disentangle due to the missing of [N ii] observations and low velocity resolution of the spectra. If we adopt the fraction of [C ii] coming from ionized gas to be 53% (typical for normal spirals; Lapham et al., 2017) for the central region and 20% for the SLIM fields, the [C ii]/CO(3–2) ratio is still higher in the center. As for the [C ii]/FIR ratio, subtracting the fraction of [C ii] from ionized gas will lower this ratio in the center and enhance the increasing trend with radius.
In addition to the dependency on gas density and FUV intensity, the abundance of different phases of carbon can also be affected by cosmic rays (CRs). CO embedded deep in molecular clouds that are shielded against UV photons can still be effectively destroyed by CRs via He+, leaving the carbon in either C or C+ phase (Bisbas et al., 2015). As suggested by Bisbas, Schruba & van Dishoeck (2019), high level of CRs can result in decreasing of CO abundance, while [C ii] abundance is barely affected or slightly increased. We note that in high density ( cm-3) and high kinetic temperature (100 K) environments in the Milky Way, CO brightness can increase with CR ionization rate (Pellegrini et al., 2009). This could be due to efficient destruction of the He+ that is otherwise responsible for CO dissociation in these environments, while in average ISM conditions as well as in the M31 center, where the density and temperature are relatively low, CO can still be destroyed via He+ (Bisbas et al., 2017).


We also derived the physical properties in the central region using the PDR model in the Photo Dissociation Region Toolbox (PDRT; Pound & Wolfire, 2008; Kaufman et al., 2006)222http://dustem.astro.umd.edu/pdrt/. The model assumes a 2D slab of ISM, and solves the chemistry, radiative transfer and thermal balance in the PDR. Using the [O i]/[C ii], ([O i]+[C ii])/FIR and [C ii]/CO(1–0) line ratios as diagnostics, the model can constrain gas density (in units of cm-3) and incident FUV intensity (in units of the local interstellar field value, 1.6; Habing, 1968), as shown in Figure 6. Here we assume a CO(3–2)/CO(1–0) line ratio of unity, according to Li et al. (2019).
Since the model only considers the PDR, [C ii] from ionized gas should be subtracted, so we corrected the [C ii] emission by assuming that 53% of the [C ii] is from ionized gas (Lapham et al., 2017). In addition, the model assumes the cloud is illuminated by FUV emission from one side, while in the optically thin case, the emission is from both sides, so we divided the FIR flux by a factor of 2, as suggested by Kaufman et al. (1999). We also calculated the ratios using the uncorrected [C ii] and FIR flux, as shown in the left panel of Figure 6. The intersections of the curves indicate the best-fit values. The minimum distribution is at (, ) = (1.78, ) and (, ) = (, 3.16) for the uncorrected and corrected ratios, respectively.
The gas density derived from the PDR model is low compared to the Milky Way center (10; Oka et al., 2012), while consistent with previous studies of M31 center (e.g. Dong et al., 2015). The relatively low gas density is also consistent with the high [C ii]/CO(3–2) ratio in this region, as discussed above. To have a consistency check of the radiation field intensity of M31 center, we calculated the mean stellar density using the total stellar mass of 1.4 within the central 680 pc (Dong et al., 2015), resulting in 45 M. This value is approximately two orders of magnitude higher than the local value ( 0.1 M; Holmberg & Flynn, 2000), hence the radiation field intensity is reasonable. The radiation field intensity of M31 center is comparable to other nearby nuclei, such as M33 (Kramer et al., 2020), NGC 3184 and NGC 628 (Abdullah et al., 2017), while stronger than the Milky Way disk ( 1-30; Pineda et al., 2013).
5 Summary
We have carried out the first mapping of FIR fine structure lines [C ii], [O i] and [O iii] on the nuclear spiral of M31 with PACS spectroscopic observations. Our main results are as follows:
-
(i)
The three lines all exhibit significant emission along the nuclear spiral, while [O i] has a lower SNR and appears more patchy than the other two. The morphology of [C ii] emission is consistent with CO(3–2) in the southern half of the nuclear spiral, while [O iii] is more similar to H emission arising from ionized gas.
-
(ii)
The [C ii]/CO(3–2) ratio is higher in M31 center than in the disk. We found that this ratio has a positive correlation with the FUV flux, and a negative correlation with the dust mass surface density.
-
(iii)
The [C ii]/FIR ratio is 5.4 ( 0.8) 10-3 in the central region which is lower than in the disk. This ratio has an increasing trend with galactocentric radius, which could be due to an increasing contribution from old stellar populations to dust heating towards the center.
Future observations of the [C i] line would enable us to determine the abundance of carbon in different phases, and also the fraction of the molecular gas that cannot be traced by CO (the so-called CO-dark gas) in the circumnuclear region. Furthermore, combining the FIR line observations with our optical integrated field spectroscopy (Z. Li et al. in preparation), we will be able to build a comprehensive view of the kinematics and ionization mechanisms of the multiphase ISM in this region.
References
- Abdullah et al. (2017) Abdullah, A., Brandl, B. R., Groves, B., et al. 2017, ApJ, 842, 4
- Abel (2006) Abel, N. P. 2006, MNRAS, 368, 1949
- Bakes & Tielens (1994) Bakes, E. L. O., & Tielens, A. G. G. M. 1994, ApJ, 427, 822
- Bisbas et al. (2015) Bisbas, T. G., Papadopoulos, P. P., & Viti, S. 2015, ApJ, 803, 37
- Bisbas et al. (2017) Bisbas, T. G., van Dishoeck, E. F., Papadopoulos, P. P., et al. 2017, ApJ, 839, 90
- Bisbas, Schruba & van Dishoeck (2019) Bisbas, T. G., Schruba, A., & van Dishoeck, E. F. 2019, MNRAS, 485, 3097
- Brauher et al. (2008) Brauher, J. R., Dale, D. A.,& Helou, G. 2008, ApJS, 178, 280
- Braun et al. (2009) Braun R., Thilker D. A., Walterbos R. A. M., Corbelli E., 2009, ApJ, 695, 937
- Brinks (1984) Brinks E., 1984, . PhD thesis, Univ. Leiden, Leiden
- Brown et al. (1998) Brown, T. M., Ferguson, H. C., Stanford, S. A., & Deharveng, J.-M. 1998, ApJ, 504, 113
- Ciardullo et al. (1988) Ciardullo R., Rubin V. C., Ford W. K., Jr., Jacoby G. H., Ford H. C., 1988, AJ, 95, 438
- Croxall et al. (2012) Croxall, K. V., Smith, J. D., Wolfire, M. G., et al. 2012, ApJ, 747, 81
- De Looze et al. (2014) De Looze, I., Cormier, D., Lebouteiller, V., et al. 2014, A&A, 568, A62
- Devereux et al. (1994) Devereux, N. A., Price, R., Wells, L. A., & Duric, N. 1994, AJ, 108, 1667
- Dong et al. (2015) Dong, H., Li, Z., Wang, Q. D., et al. 2015, MNRAS, 451, 4126
- Dong et al. (2016) Dong H., Li Z.,Wang Q. D., Lauer T. R., Olsen K. A. G., Saha A., Dalcanton J. J., Groves B. A., 2016, MNRAS, 459, 2262
- Draine et al. (1978) Draine, B. T. 1978, ApJS, 36, 595
- Draine et al. (2014) Draine B. T., Aniano, G., Krause, O., et al., 2014, ApJ, 780, 172
- Ford et al. (2013) Ford G. P. et al., 2013, ApJ, 769, 55
- Groves et al. (2012) Groves B. et al., 2012, MNRAS, 426, 892
- Gullberg et al. (2015) Gullberg, B., De Breuck, C., Vieira, J. D., et al. 2015, MNRAS, 449, 2883
- Habing (1968) Habing, H. J. 1968, BAN, 19, 421
- Heiles (1994) Heiles, C. 1994, ApJ, 436, 720
- Helou et al. (1988) Helou, George, et al., 1988, ApJS, 68:151-172
- Helou et al. (2001) Helou, G., Malhotra, S., Hollenbach, D. J., Dale, D. A., & Contursi, A. 2001, ApJL, 548, L73
- Herrera-Camus et al. (2015) Herrera-Camus, R., Bolatto, A. D., Wolfire, M. G., et al. 2015, ApJ, 800, 1
- Holmberg & Flynn (2000) Holmberg, J., & Flynn, C. 2000, MNRAS, 313, 209
- Jacoby, Ford & Ciardullo (1985) Jacoby G. H., Ford H., Ciardullo R., 1985, ApJ, 290, 136
- Kapala et al. (2015) Kapala M. J. et al., 2015, ApJ, 798, 24
- Kapala et al. (2017) Kapala, M. J., Groves, B., Sandstrom, K., et al. 2017, ApJ, 842, 128
- Kaufman et al. (2006) Kaufman, M. J., Wolfire, M. G., & Hollenbach, D. J. 2006, ApJ, 644, 283
- Kaufman et al. (1999) Kaufman, M. J., Wolfire, M. G., Hollenbach, D. J., & Luhman, M. L. 1999, ApJ, 527, 795
- Kessler et al. (1996) Kessler M.F., Steinz J.A., Anderegg M.E., et al., 1996, A&A315, L27
- Kramer et al. (2020) Kramer, C., Nikola, T., Anderl, S., et al., 2020, arXiv:2005.03683
- Lapham et al. (2017) Lapham, R. C., Young, L. M., & Crocker, A. 2017, ApJ, 840, 51
- Lavalley & Feigelson (1992) Lavalley, M., Isobe, T., & Feigelson, E. 1992, Astronomical Data Analysis Software and Systems I, 245
- Li et al. (2011) Li Z., Garcia M. R., Forman W. R., Jones C., Kraft R. P., Lal D. V., Murray S. S., Wang Q. D., 2011, ApJ, 728, L10
- Li et al. (2020) Li Z., Li Z., Smith M.W.L., Wilson C.D., Gao Y., et al. 2020, MNRAS, 492, 195
- Li et al. (2019) Li Z., Li Z., Zhou P., Gao Y., Jiang X.-J., Dong H., 2019, MNRAS, 484, 964
- Li et al. (2009) Li, Z., Wang, Q. D., & Wakker, B. P., 2009, MNRAS, 397, 148
- Malhotra et al. (1997) Malhotra S. et al., 1997, ApJ, 491, L27
- Malhotra et al. (2001) Malhotra, S., Kaufman, M. J., Hollenbach, D., et al. 2001, ApJ, 561, 766
- McConnachie et al. (2005) McConnachie A. W., Irwin M. J., Ferguson A. M. N., Ibata R. A., Lewis G. F., Tanvir N., 2005, MNRAS, 356, 979
- Melchior & Combes (2013) Melchior A. L., Combes F., 2013, A&A, 549, A27
- Mochizuki (2000) Mochizuki K., 2000, A&A, 363, 1123
- Muraoka et al. (2007) Muraoka K. et al., 2007, PASJ, 59, 43
- Oka et al. (2012) Oka, T., Onodera, Y., Nagai, M., et al. 2012, ApJS, 201, 14
- Ott (2010) Ott, S. 2010, in ASP Conf. Ser. 434, Astronomical Data Analysis Software and Systems XIX, ed. Y. Mizumoto et al. (San Francisco, CA: ASP), 139
- Pellegrini et al. (2009) Pellegrini, E. W., Baldwin, J. A., Ferland, G. J., Shaw, G., & Heathcote, S. 2009, ApJ, 693, 285
- Petuchowski et al. (1993) Petuchowski, S. J., & Bennett, C. L. 1993, ApJ, 405, 591
- Pilbratt et al. (2010) Pilbratt, G. L., Riedinger, J. R., Passvogel, T., et al. 2010, A&A, 518, L1
- Pineda et al. (2013) Pineda, J. L., Langer, W. D., Velusamy, T., & Goldsmith, P. F. 2013, A&A, 554, A103
- Pineda et al. (2018) Pineda J. L., et al., 2018, ApJ, 869, L30
- Poglitsch et al. (2010) Poglitsch, A., Waelkens, C., Geis, N., et al. 2010, A&A, 518, L2
- Pound & Wolfire (2008) Pound, M. W., & Wolfire, M. G. 2008, in ASP Conf. Ser. 394, Astronomical Data Analysis Software and Systems, ed. R. W. Argyle et al. (San Francisco, CA: ASP), 654
- Rollig et al. (2006) Rollig, M., Ossenkopf, V., Jeyakumar, S., Stutzki, J., & Sternberg, A. 2006, A&A, 451, 917
- Sanders & Mirabel (1996) Sanders, D. B., & Mirabel, I. F. 1996, ARA&A, 34, 749
- Stacey et al. (1991) Stacey, G. J., Geis, N., Genzel, R., et al. 1991, ApJ, 373, 423
- Stacey et al. (2010) Stacey G. J., Hailey-Dunsheath S., Ferkinhoff C., Nikola T., Parshley S. C., Benford D. J., Staguhn J. G., Fiolet N., 2010, ApJ, 724, 957
- Strzer et al. (1996) Strzer H., Stutzki J. & Sternberg A. 1996, A&A, 310, 592
- Thilker et al. (2005) Thilker, D. A., Hoopes, C. G., Bianchi, L., et al. 2005, ApJL, 619, L67
- Tielens & Hollenbach (1985) Tielens, A. G. G. M., & Hollenbach, D. 1985, ApJ, 291, 722
- van den Bergh (1969) van den Bergh S., 1969, ApJS, 19, 145
- Viaene et al. (2017) Viaene S. et al., 2017, A&A, 599, A64
- Weingartner & Draine (2001) Weingartner, J. C., & Draine, B. T. 2001, ApJS, 134, 263
- Wilson et al. (2009) Wilson C. D. et al., 2009, ApJ, 693, 1736