A direct sampling method for simultaneously recovering inhomogeneous inclusions of different nature
Abstract
In this work, we investigate a class of elliptic inverse problems and aim to simultaneously recover multiple inhomogeneous inclusions arising from two different physical parameters, using very limited boundary Cauchy data collected only at one or two measurement event. We propose a new fast, stable and highly parallelable direct sampling method (DSM) for the simultaneous reconstruction process. Two groups of probing and index functions are constructed, and their desired properties are analyzed. In order to identify and decouple the multiple inhomogeneous inclusions of different physical nature, we introduce a new concept of mutually almost orthogonality property that generalizes the important concept of almost orthogonality property in classical DSMs for inhomogeneous inclusions of same physical nature in [12, 13, 14, 24, 31]. With the help of this new concept, we develop a reliable strategy to distinguish two different types of inhomogeneous inclusions with noisy data collected at one or two measurement event. We further improve the decoupling effect by choosing an appropriate boundary influx. Numerical experiments are presented to illustrate the robustness and efficiency of the proposed method.
Key words. Inverse problem, direct sampling method, simultaneous reconstruction, decoupling imaging technique.
AMS subject classifications. 35J67, 35R30, 65N21, 78M25.
1 Introduction
In this work, we propose a novel parameter reconstruction method in which we decouple measurements from one (or at most two) pair(s) of Cauchy data and locate two different types of inhomogeneities in the model. Let us consider an open bounded domain in (, ) with a smooth boundary , and the following elliptic PDE:
| (1.1) |
where the coefficients , represent two unknown physical inclusions in the physical ranges and for some , . Let and be the respective coefficients describing the homogeneous background medium . We assume two physical inclusions are in the interior of the domain, i.e., , . Our goal is to simultaneously identify and reconstruct these two inclusions, i.e., and , using the data measured on the boundary corresponding to a boundary influx . We like to point out that our proposed method can be appropriately generalized to handle other types of boundary conditions that may arise in real applications, e.g. the Robin boundary condition, although this work focuses only on a Neumann boundary condition (cf. (1.1)).
Inverse problems of the elliptic system (1.1) may arise from a wide range of applications, such as medical imaging, geophysical prospecting, nano-optics, and nondestructive testing; see, e.g., [19, 33, 37, 41] and the references therein. The solution and two coefficients and may represent different physical state and parameters in different applications. For instance, in the diffusion-based optical tomography [5], , and represent the photon density, diffusion and absorption coefficients, respectively; Identification of locations of inhomogeneities of and helps determine the distribution of different types of tissues. The model (1.1) can also represent the inverse electromagnetic scattering problem. Under the transverse electric symmetry, the three-dimensional full Maxwell equations may be reduced to (1.1), where and stand for the permeability and permittivity of the media [39]. The system (1.1) is also adopted in the ultrasound medical imaging, where and represent the volumetric mass density and bulk modulus, respectively, while describes the acoustic pressure [2]. For the convenience of descriptions, we shall often call and as conductivity and potential throughout this work.
The uniqueness and simultaneous identifiability for the elliptic inverse problem (1.1)) have been widely investigated. In particular, a negative result was proved in [6], that is, no uniqueness for the simultaneous reconstruction of and when both coefficients are smooth. For piecewise constant and piecewise analytic , the uniqueness and simultaneous identifiability were established in [23] for real-valued coefficients, as long as all possible Neumann-to-Dirichlet data are available. This uniqueness result also hints why there are many reasonable numerical results for simultaneous reconstructions, even though there is still no general uniqueness result.
During the recent two decades, many efficient numerical methods were proposed for the inverse problem (1.1). Minimizing a least-squared functional with appropriate regularizations is a very popular methodology in many applications, along with iterative methods; see, e.g., [7, 17, 18, 29, 40]. Usually, a locally convergent Newton-type method is employed. However, an iterative scheme may be trapped often in local optima, owing to high ill-posedness and high non-convexity of the objective functional. Moreover, the high dimension of the optimization problem also hinders the performance of this type of algorithms. Therefore there is a significant interest to develop some alternative numerical methods, that are fast, computationally cheap and robust against noisy data, to provide a reasonable initial guess for these iterative methods. On the other hand, some rough estimates of the inhomogeneous inclusions directly from the measurement data may be sufficient for many practical applications.
Motivated by these two important applications, many non-iterative schemes were developed for a large class of inverse problems for parameter identifications. Most of those methods are sampling-type, which rely on an appropriately designed functional that is expected to attain relatively large values inside the inhomogeneity. These include linear sampling method [15], singular source method [34], and factorization method [26], etc. Recently, MUSIC-type method using the multistatic response matrix (MSR) [4, 27], algorithms based on the topological derivative [8], and the reverse time migration [10] were also developed for the purpose. We refer to several recent monographs [9, 11, 28, 35] for more developments in this direction. Nevertheless, to the best of our knowledge, there seems to exist little development of sampling type methods for simultaneously reconstructing two different types of inhomogeneities.
In this work, we make the first effort to develop a new sampling type method, a direct sampling method (DSM), for simultaneously identifying and recovering multiple inhomogeneous inclusions corresponding to two different physical parameters. In particular, a specific attempt is made to ensure that the method can apply to the important scenarios where very limited data is available, e.g., only noisy data collected at one or two measurement event. DSMs have been developed recently through a series of efforts, e.g., [12, 13, 14, 24, 31, 34], for recovering the inhomogeneous media, first for the wave type inverse problems, and then for the non-wave inverse problems. This family of direct sampling methods construct an index function that leverages upon an almost orthogonality property between the family of fundamental’s functions of the forward problem and a particular family of probing functions under a properly selected Sobolev duality product. All the existing DSMs were designed for the cases when there are only inhomogeneous inclusions of same physical nature. In this work, we make the first attempt to design DSMs for simultaneously recovering multiple inhomogeneous inclusions of two very different physical parameters. These inverse scattering problems are much more ill-posed and challenging than those associated with inclusions of same physical nature. A natural mathematical and technical issue is how to identify which inclusions come from one physical parameter, not from the other; and how to locate and separate the multiple inclusions corresponding to one parameter from those corresponding to the other. We shall make use of an important observation that the near field or scattered data satisfies a fundamental property that it can be approximated as a combination of Green’s functions and their gradients at a set of discrete points. With this observation, we shall develop two separate families of probing functions, namely, the monopole and dipole probing functions, which enable us to construct two separate index functions for decoupling the multiple inhomogeneous inclusions associated with one physical parameter from those associated with the other parameter. In order for this decoupling to function effectively, we introduce a new and key concept, the mutually almost orthogonality property, between the family of fundamental functions and their gradients, and two families of monopole and dipole probing functions. Furthermore, we take advantage of an additional parameter, namely the probing direction of the dipole probing function, and an appropriate boundary influx to decouple the multiple inhomogeneous inclusions of one parameter from those of the other parameter. As we will see, the new method is computationally cheap and numerically stable, and works quite satisfactorily, as demonstrated in section 6 by several typical challenging numerical examples with very limited data available, e.g., only noisy data collected at one or two measurement event. The outputs generated by the new method can serve as reasonable approximations for many important applications where general rough locations and shapes of inhomogeneous inclusions are sufficient, or as a quick and stable initial guess of some expensive nonlinear optimization approaches when more accurate reconstructions are needed.
The rest of our work is as follows. We address in section 2 the general principles of DSMs, including the fundamental property and the new mutually almost orthogonality property. We then show in section 3 that the fundamental property holds for our inverse problem in many cases that we encounter in practice. We propose in section 4 two index functions for the reconstruction process and discuss their properties, including an alternative characterization. In section 5, we derive some explicit representations of the probing and index functions in some special sampling domains and discuss the mutually almost orthogonality properties in those cases. We will also address some appropriate boundary influxes to further decouple the monopole and the dipole effects in the measurement. Numerical experiments are conducted in section 6 to illustrate the effectiveness of the new method.
2 Principles of DSMs with coupled measurement
We briefly explain in this section some general observations that motivate our direct sampling method with coupled measurement. The development of our DSM hinges on a basic fact that our measurement data can be approximated by a sum of Green’s functions of the homogeneous equation and their gradients. With this in mind, along with an appropriate choice of the Sobolev duality product, those Green’s functions and their gradients located at different sampling points are respectively nearly orthogonal with two properly selected families of probing functions. These two families of probing functions are monopole-type and dipole-type functions, and couple well with the Green’s function and its gradient respectively. This is a very important property to our new method, and will be called the mutually almost orthogonality property, namely, the Green’s functions interact well only with monopole probing functions, while the gradient of Green’s functions interact well solely with dipole probing functions. This allows us to decouple the monopole and the dipole effects. Moreover, different types of boundary influxes and probing directions can be chosen to maximize the decoupling effect.
To be more precise, we aim to make use of the following two properties to develop an effective and robust direct sampling method:
-
1.
(Fundamental property) The boundary data, i.e., on , of the model (1.1) can be represented approximately by a sum of Green’s functions of the homogeneous medium and their gradients:
for some choices of coefficients , , and the sets of discrete points , .
-
2.
(Mutually almost orthogonality property) There are two sets of probing functions, namely representing a family of monopole probing functions at sources , and representing a family of dipole probing functions at sources and dipole directions , such that the following four kernels
have the following properties, under two appropriate couplings , and weights for and for , :
is of large magnitude if is close to , and is small otherwise, is relatively small, is relatively small, is of large magnitude if and , and is small otherwise.
The above mutually almost orthogonality property means that the two families of probing functions, i.e., monopole and dipole probing functions, interact well with only the Green’s functions and their gradients respectively. This is a very important property that allows us to decouple the monopole and dipole effects in the measurement data.
With the above definitions and the fundamental property, we can define two index functions
| (2.1) |
which have the approximations
From the above, we can see from the mutually almost orthogonality property that the index function has a large magnitude if is close to one of the points inside the potential inclusions, i.e., supp, and is small otherwise. Meanwhile, the index function has a large magnitude if is close to one of the points inside the conductivity inclusions, i.e., supp, as well as for such , and is small otherwise. Therefore, this decouples the effect of Green’s functions and their gradients in the near field or scattered data with the help of monopole and dipole probing functions, thanks to the mutually almost orthogonality property. In order to maximize such a decoupling effect, different types of boundary influxes and probing directions are also analysed. The above properties and strategies for decoupling will be addressed in further detail in the rest of the work.
Under the settings above, two index functions in (2.1) give rise to our new Direct Sampling Method:
Given the measurement data on , and a set of discrete sampling points ,
(i) evaluate to recover the potential inclusions, i.e., supp;
(ii) evaluate to recover the conductivity inclusions, i.e., supp.
3 Fundamental property
In this section, we aim to verify the fundamental property introduced in section 2 for some typical cases that we encounter in real applications. In particular, we intend to derive an approximation of the measurements as a combination of the Green’s functions of the homogeneous medium and their gradients when is either smooth or piecewise constant.
Associated with the model (1.1), the incident field from the homogeneous background satisfies
| (3.1) |
Combining the systems (1.1) and (3.1), we readily see
| (3.2) |
If , we consider the Green’s function for satisfying
| (3.3) |
Then the difference can be represented by
| (3.4) |
On the other hand, if , we consider the following Green’s function for instead:
| (3.5) |
Then we can obtain a similar representation to (3.4).
From now on, we shall consider only the following two typical cases: either is smooth or piecewise constant. First for the case when , by writing , we can readily derive from (3.4) by the divergence theorem that
| (3.6) |
Next, we consider the case when is piecewise constant. We assume that , where are open subsets of with smooth boundary such that , and that in for some constant . And we further write for simplicity. Then for all , we derive from (1.1) that
| (3.7) |
Noticing that the normal derivative of has a jump across , we get for from (3.7) that
where we have chosen the normal vector to point towards on each , and will write the jump of any function across the boundary as . The above equation readily implies the equation for
| (3.8) |
For any , we can easily write
| (3.9) |
Applying the Green’s formula in to the first part of the above difference, we obtain
| (3.10) |
Meanwhile, for the second part of the difference in (LABEL:pc1), we notice the following for each :
| (3.11) |
Combining (LABEL:pc1)-(LABEL:pc3), we come to the difference of the potentials
| (3.12) | ||||
Now using some appropriate numerical quadrature rule, we can easily see from the expressions (3.6) and (3.12) that the boundary data or the scattered field can be approximated by
| (3.13) |
for some coefficients , , , and some quadrature points and . We have therefore verified the fundamental property introduced in section 2.
4 Probing and index functions
4.1 Monopole and dipole probing functions
In order to accurately locate the respective medium inhomogeneities and , we are expected to decouple the effects of the Green’s function and in (3.13). For this purpose, we define two groups of probing functions, representing a family of monopole probing functions from sources , and representing a family of dipole probing functions from sources and dipole directions .
We first introduce the family of monopole probing functions . For a point , we consider a monopole potential satisfying
| (4.1) |
We then define as the boundary flux of
| (4.2) |
To avoid the approximation of a delta measure in computing , we may evaluate using its equivalent expression , where is the fundamental solution in the whole space with any appropriate boundary condition, namely
| (4.3) |
while solves
| (4.4) |
Next we define another family of dipole probing functions . Given and , we consider the dipole potential satisfying
| (4.5) |
then we define as the boundary flux
| (4.6) |
Similarly, to avoid the approximation of a delta measure in computing , we may evaluate using its equivalent expression , where is defined as (4.3) with the right-hand side replaced by while is defined as (4.4).
4.2 Monopole and dipole index functions
We are now ready to define two critical index functions that give rise to our new direct sampling method. For this purpose, for a given and an auxiliary choice of , we introduce a Sobolev duality product
| (4.7) |
We notice that for , , the above duality product is the standard definition of a -semi-inner product on . However, the argument in (4.7) will play the role of the noisy measurement from the forward problem, which exists generally only in for some . For simplicity, we will often write instead of , and use as the semi-norm induced by the duality product in (4.7). is often called a Sobolev scale.
We are now ready to introduce our two index functions. First, for any , , we know , for any , . Then corresponding to the monopole probing functions in (4.2) and the dipole probing functions (4.6), we define the index functions as follows:
| (4.8) | |||||
| (4.9) |
under appropriate choices of two Sobelov scales and and the coefficients and .
Using (3.13), we have the approximations
where the kernels for are now respectively given by
| (4.10) | ||||||
| (4.11) |
Therefore, if we have the mutually almost orthogonality property between the two families of probing functions and the fundamental solution with its gradient respectively under the aforementioned duality product, we shall be able to decouple the effects coming from monopoles and dipoles, and reconstruct inhomogeneous inclusions as well as recognize their types with one or two pair(s) of Cauchy data. In section 5, we will verify these desired properties of probing functions under our special choice of the duality product in some typical sampling domains.
We end this subsection with two helpful remarks:
-
1.
In order to numerically evaluate our index functions efficiently from the measurement data, we need only to compute the Sobolev duality product approximately after discretization. The approximations of the norm and pointwise values of probing functions can be all computed off-line. The entire algorithm does not involve any iterative procedure or matrix inversion.
-
2.
We would like to comment on the intuition of what the surface Laplacian in (4.7) does. Considering the fact that when approaches the boundary, one may represent the Laplacian in terms of the surface Laplacian operator (up to the boundary)
(4.12) where represents the mean curvature of embedded in at the point and the normal derivative is taken outward from the inside. Therefore, we may expect that, by choosing a larger value of Sobolev scale , we are essentially taking a higher order normal derivative of the boundary measurement in the distributional sense, i.e., a higher order flux of the measurement at the boundary. Hence, taking a bigger in the duality product amounts to comparing the higher order details of probing functions along the boundary (either in the tangential or normal direction) with that of monopole/dipole functions in the measurement. This can improve the reconstruction results; see our numerical studies in Example 1 of section 6.
4.3 Alternative characterization of index functions
In order to simplify the computation and obtain a better understanding of the index functions (4.8) and (4.9), as well as to make an optimal choice of the probing direction there we now present an alternative characterization of the index functions. For this purpose, let us consider to be an auxiliary function that solves
| (4.13) |
where the boundary condition is understood in the distributional sense. Using the definitions (4.6) and (4.7), we can easily observe that
| (4.14) |
Similarly, from definitions (4.2) and (4.7), we readily obtain
| (4.15) |
With the help of the above expressions, we can therefore rewrite (4.8) and (4.9) as
| (4.16) |
The above understanding of the index functions helps in two folds:
-
1.
First, this provides us another way to quickly compute index functions. In particular, given that is smooth enough, we could quickly evaluate the surface Laplacian. It then remains to numerically solve a Dirichlet boundary value problem for by any appropriate numerical method.
-
2.
This expression helps us obtain an optimal choice of the probing direction at each point . In fact, based on the expression (4.16), we can see that the magnitude of can be maximized by choosing parallel to , and minimized when we choose a that is orthogonal to . Therefore, in order to locate , we may therefore maximize by choosing
(4.17) This serves as a guide for an optimal probing direction.
5 Explicit expressions of probing functions and index functions in some special domains
In this section, we aim at obtaining some explicit expressions of our choices of probing functions in some special domains for more efficient numerical computation. With the same technique, We can also obtain explicit expressions of kernels introduced in (4.10) and (4.11) in those cases, which help us understand more precisely the behaviour of those kernels, and verify the mutually almost orthogonality properties.
For the notational sake, we shall write from now on. The Poincare-Steklov operator plays an essential role in our subsequent analysis. We define the Neumann-to-Dirichlet map (NtD) as , where and satisfy the equations
| (5.1) |
We recall that is a compact self-adjoint operator when we restrict ourselves to . Therefore, there exists a complete orthonormal basis consists of eigenfunctions of . We notice that, in some special cases, this set of eigenfunctions coincides with the set of eigenfunctions of the surface Laplacian . This helps us to write both probing functions and the semi-inner product defined in (4.7) explicitly via Fourier coefficients with respect to the same orthonormal basis. In this section, we will focus on one such case, that is when for some and , which is a typical geometric shape used in many applications.
We like to point out that, although the two sets of eigenfunctions differ in general, they are comparable to each other based on the following observation: if we denote , the dual norm of under the metric on the surface, then the principle symbol of is , while that of is (Proposition 8.53, [38]). With this, via an application of the generalized Weyl’s law, we can obtain a precise comparison of the pointwise asymptotic average squared density between the two sets of eigenfunctions. In fact, one readily checks that the volume of the variety coming from the two Hamiltonians and are in fact the same, and the generalized Weyl’s law will therefore render us that the two sets of eigenfunctions have the same pointwise asymptotic average squared density in some sense mathematically. We skip the details of this argument for the sake of exposition, and focus only on the case for some , when the two sets of eigenfunctions coincide.
5.1 Circular domains
Now let us consider the special case when the domain is a disk with radius centered at the origin. We consider the following Poincare-Steklov eigenvalue problem:
| (5.2) |
Writing as the modified Bessel function of the first kind of order , we readily obtain, via a separation of variables, that eigenfunctions of and their associated eigenvalues are given by
| (5.3) |
From these explicit expressions, one can readily find for and that
| (5.4) | |||||
| (5.5) |
Recalling the definition of the dipole probing function in (4.6), we obtain their Fourier coefficients
| (5.6) |
Similarly, from the definition of the monopole probing function in (4.2), we derive
| (5.7) |
On the other hand, we can deduce from definitions (3.3) and (5.2) that
| (5.8) |
Differentiating (5.8) with respect to , and considering the symmetry of the Green’s function in (3.3), i.e., , we obtain
| (5.9) |
Now let us recall the definition of the duality product in (4.7). When , with , one may readily check that , and therefore
| (5.10) |
Using (5.6)-(5.10), we can obtain the explicit expressions of the duality products and semi-norms
| (5.11) | |||||
| (5.12) | |||||
| (5.13) | |||||
| (5.14) |
| (5.15) | ||||||
| (5.16) |
5.1.1 More about the mutually almost orthogonality property
We shall focus only on the case of Sobolev scale , and the cases of other follow similarly.
Case 1: . For given , one may quickly obtain
| (5.17) |
We first consider . For convenience, we write , in the polar coordinates and . Using the fact that , (5.11) can be simplified as
| (5.18) |
We may notice that the above inequalities become equalities if (i.e. ) and , that is, when the maximum is attained for fixed and . Applying a similar trick, we further obtain from (5.15) and (5.16) that
| (5.19) | ||||||
| (5.20) |
To better understand the behaviour of the kernel , let us fix and in (5.18) for the time being. Then we like to check if the maximum of , which is now a rational function of , is attained when . While the explicit optimum is hard to find analytically, we can obtain them by solving the KKT optimality system via numerical approximations. The second plot in Fig. 1 shows the value of that maximizes with , , and . We may observe that, the function is very close to the linear function . For instance, we may check that when , the maximum value is attained when ; and when , the maximum value is attained when . Therefore, we can verify the almost orthogonality property numerically in the most part of the domain for .


We next study defined as in (4.10). We can similarly deduce the explicit expression of the numerator of when as
| (5.21) |
We can see that the equalities hold when in (5.21), that is, when the maximum is achieved for fixed and . Let us now fix and in (5.21), we like to check again if the maximum of , which is a rational function of , is attained when . Similarly, we may approximate them by solving the KKT optimality system via numerical approximations. The first plot in Fig. 1 describes the value of that maximizes with . We may observe that, the function is very close to the linear function . For instance, we may check that when , the maximum occurs at ; and when , the maximum happens at . Therefore we have verified numerically that the maximum of occurs when is very close to , which is the desired almost orthogonality property.
Now we consider the decoupling effect, i.e., to check the full version of the mutually almost orthogonality property. For this purpose, we like to compare behaviours of and with and defined in (4.10) and (4.11). We obtain from (5.13) and (5.12) which provide explicit representations of numerators of and that
| (5.22) | ||||
| (5.23) | ||||
We may now see a very interesting behaviour: a minimum (i.e., zero) of and are attained when , , and . This is an ideal behaviour as the maximum of the numerator of and occur at and by using (5.18) and (5.21), therefore helps contrast and with and .
In Figs. 2-4, mutually almost orthogonality properties are further studied through numerical experiments for . From these results, we may see that there is a monopole located at and a dipole located at . To clearly illustrate the decoupling effect by considering the situation when the influence of the monopole and the dipole on the boundary are comparable, the monopole is multiplied by a constant with respect to our expressions in (5.21) and (5.23). We also take (, ) and denote the locations of and using a yellow cross and a blue cross respectively. In what follows, represents , where is the angular coordinate in polar coordinates for .
-
1.
In Fig. 2, the first plot is for . This plot demonstrates the desired property of , and we notice that the maximum occurs when is very close to . We then assume ; the second plot in Fig. 2 is , with . We can observe that the maximum occurs when , given the appropriate probing direction. The third plot is for with . We notice that even if there is a moderate perturbation from the best probing direction (), the maximum of the kernel function is not very far away from the point . The last plot is the case when . In this case, two peaks of the kernel function appear around the point with a dipole, and the maximum value in the figure is smaller than the case when . This illustrates that a reasonable probing direction is essential for the accurate determination of the location of a dipole.
-
2.
In Fig. 3, we demonstrate behaviours of with , and with from left to right. There are two important observations: the maxima of and are smaller than that of and ; for the case , the maximum appears at two sides of the point instead of being right at the spot.
-
3.
In Fig. 4, we examine the coexistence of a monopole at and a dipole at . The first plot can be considered as probing by , while the second and third plots can be considered as probing by under different probing directions. We may conclude that the monopole probing function interacts better with the monopole located at , while the dipole probing function interacts better with the dipole located at , under an appropriate probing direction.


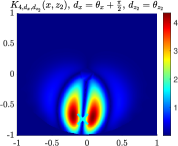
Case 2: . In this case, the kernel functions are expressed in terms of Bessel functions. A closed formula is hard to obtain, so we will verify the mutually almost orthogonality property mainly through numerical experiments. We first derive the explicit representations of the numerators of , , , through (5.11) to (5.14)
| (5.24) | |||
| (5.25) | |||
| (5.26) |
| (5.27) | ||||
Similarly, the explicit expressions for semi-norms can be derived from (5.15) and (5.16) as
| (5.28) | ||||
| (5.29) |
| (5.30) |
Numerical experiments are conducted again to verify the mutually almost orthogonality property of the kernel functions in Figs. 5-8, with and . Three points are chosen in , i.e., , , , and the constants (, ) are selected as the normalizations which are used in (4.8) and (4.9). In the following figures, the yellow cross and the blue cross represent the location of a monopole and a dipole respectively.
-
1.
Fig. 5 plots the kernel for . We can clearly see its maximum is attained when , hence verifies the almost orthogonality property of .
-
2.
Fig. 6 plots the kernel for . With an appropriate probing direction, we can clearly see its maximum is attained when and , hence verifies the almost orthogonality property of .
-
3.
We show in Fig. 7 the effect of the probing direction. In the first plot, we examine the special choice of the probing direction such that at , and see the kernel function can not properly indicate the location of the dipole. The second and third plots demonstrate the behaviours of and when , . We notice that as in the case , the peaks of the kernel functions appear to be very close to the location of the dipole or the monopole. Meanwhile we see clearly that the value of is larger than the peak values of and .
-
4.
In Fig. 8, we examine the coexistence of a monopole at and a dipole at . To consider the case when the influence of the monopole and the dipole are comparable on the boundary, we enhance the strength of the monopole by multiplying a constant . The first plot can be considered as probing by , while the second and third plots can be considered as probing by under different probing directions. We may conclude that the monopole probing function interacts better with the monopole located at , while the dipole probing function interacts better with the dipole located at , under an appropriate probing direction.


.


5.1.2 Explicit representations of probing functions in terms of Bessel function
Before we continue to explore the mutually almost orthogonality property in other special domains, we present some explicit representations of the probing functions on the boundary of the unit disk. This will help us efficiently evaluate the inner products involved in the index functions (4.8) and (4.9). Note that the corresponding norms of the probing functions used as the weights in the index functions were already given in the previous subsection.
We first compute an explicit expression for . Via a separation of variables, the solution to (4.4) can be represented by
| (5.31) |
where , in polar coordinates, and are coefficients determined by the boundary condition. Now let us consider one special solution to (4.3), which we may choose as , where is the modified Bessel function of the second kind of order . Note that represents a point inside and represents a point on , hence we always have . Applying the Graf’s formula [1], we obtain
| (5.32) |
Furthermore, we may determine by a comparison of coefficients, and derive
| (5.33) |
Employing the relationship on the Wronskian between and [1], we then get the expression of when :
| (5.34) |
To compute , we first note that is linear with respect to different choices of , so it suffices to compute () for two canonical basis vectors and in . For simplicity, we set
| (5.35) | ||||
| (5.36) |
A particular solution to defined in (4.5) can be obtained by taking the partial derivative of in (5.33) with respect to :
| (5.37) |
Then the probing function in (4.6) with is obtained by applying the partial derivative with respect to
| (5.38) |
Similarly, can be given by
| (5.39) |
5.2 Spherical domains in for
We now derive the explicit expressions of kernels defined in (4.10) and (4.11) and the probing functions for the case of open balls in for . The analyses are quite similar to the circular case in the previous two subsections, so we will give a sketch only for and emphasize some main differences. Let be a unit ball centered at in , and and satisfy equations
| (5.40) |
Then by a separation of variables, the kernel of can be spanned by the Schauder basis . And we can readily check that can be solved by the spherical Bessel function of the first kind while can be solved by the spherical harmonic function. The eigenpairs defined in (5.1) for can be given by
| (5.41) |
Since the spherical harmonics form a complete orthogonal basis in , we may rewrite the duality product, the semi-norm, and probing functions in terms of this basis. For instance, we can write the duality product as
| (5.42) |
where is the corresponding coefficient. Then using the addition formula for Legendre polynomials, we can obtain all we need for an explicit expression of (with ):
The explicit expressions for , as well as that of the probing functions, are similar. As an example, Fig. 9 shows the almost orthogonality property for the kernel and defined in (4.10) and (4.11), with , , (, ), , and .


5.3 A decoupling strategy based on the frequency of the boundary influx
In this subsection, we investigate a decoupling strategy that makes use of the effect from changing the frequency of the boundary influx. This strategy is a very reliable and effective decoupling technique when we implement our DSM. For illustrations, we consider two different cases: the first one for two small inhomogeneous inclusions, each inhomogeneity from one of two parameters and in (1.1); the second one for one inhomogeneous inclusion.
5.3.1 Two small inhomogeneous inclusions
Let us consider a simplified situation when there are two small inhomogeneous inclusions , in . We write , , with , and . We further assume in (1.1) that in and otherwise; and in and otherwise. Under this setting, we can readily obtain the asymptotic expansion of for , uniformly as [22]:
| (5.43) |
where constants and depend only on the domain. Supposing the boundary influx is of the form on , we can get the following expressions of satisfying (3.1) and its gradient:
where . Denoting , , we can readily derive
| (5.44) |
The above comparison hints that the inhomogeneity associated with is more sensitive to the change of frequency around the local maxima of , , , when . To see this, let us consider the index function in (4.9) when Sobolev scale , then we can approximate in (4.11) by
| (5.45) |
Now from (5.44), it is ready to see that the coefficient associated with will be more significant as becomes larger compared with the coefficient associated with . Therefore, we should expect a much larger value of the index function around when the boundary influx has a higher frequency.
5.3.2 A single inhomogeneous extended inclusion
We now consider the case when there is a single inhomogenous inclusion that is not necessarily small. We compare the effects of varying two inhomogeneous coefficients and in the same inclusion. For the sake of exposition, we assume that the inhomogeneity is located in a disk with radius , and take in polar coordinates.
Case 1: is constant, but is piecewise constant, i.e., in , and otherwise. Letting , then the scattered wave and the total wave satisfy the equations
| (5.46) |
As we expect no singularity for around the origin, we may assume for some . Similarly, we write for some . By comparing Fourier coefficients, we easily see if . Therefore it suffices to consider the Fourier coefficient associated with . Using the transmission condition on , we derive
| (5.47) |
for some constant , where we have used the following estimate for Bessel functions [1]:
| (5.48) | |||||
Case 2: is constant, and is piecewise constant, i.e., in , and otherwise. Letting , we write the scattered wave for some . Again, we can see that for , hence we need to focus only on , which can be estimated as follows:
| (5.49) |
Comparison between Cases 1 and 2: Considering the ratio between the Fourier coefficients from the above two cases, we can readily see from (5.47) and (5.49) that for some constant . Noting that and represent the magnitude of the scattered waves for two different inhomogeneous inclusions respectively, this infers that the measurement coming from the inhomogeneous inclusion with a different is more sensitive than that coming from an inhomogeneous inclusion with a different at the high frequency regime of the boundary influx.
6 Numerical experiments
In this section, we present a series of typical examples to illustrate the efficiency and robustness of our proposed direct sampling method for solving the inverse coefficient problem (1.1). We take the probing domain to be the unit disk in , and the coefficients and in the homogeneous background to be , . For each numerical experiment, there are several inhomogeneities of different types that are located separately inside the domain.
Forward data. In all the experiments, we choose a boundary influx , with different . We solve the forward problem for and using a finite element method of mesh size , and take as the forward data the values of the potential at a set of discrete probing points, denoted by , distributed uniformly on the boundary of . Then the noisy data is generated by adding a random noise of multiplicative form:
| (6.1) |
where is randomly uniformly distributed in . Unless it is specified otherwise, shall often consist of points, and the noise level is chosen to be .
Then we move on to address the implementation of the new DSM. We first compute the pointwise evaluations of the monopole and dipole probing functions using the explicit expressions in section 5.1.2, and all these are carried out off-line. We then compute the monopole and dipole index functions and in (4.8) and (4.9) at each sampling point through appropriate numerical integrations. In all our numerical examples, we choose the parameters involved in (4.8) and (4.9) as follows: , , (except Example 1). At each probing point , the probing direction is chosen to be , as it is described in section 4.3.
We make a remark on the denominator of , by noting the fact that from (5.30) and hence the index function is singular around the origin when . To get rid of this singularity, we take for all , with fixed at . The same modification is also applied to .
For each example, we plot the exact inhomogeneous inclusions, along with the monopole and dipole index functions and , which are the squares of the respective normalized monopole and dipole index functions and . The choice of squaring the index functions and normalizing by their maximum are only for the sake of better illustrations, and other choices can be used as well. In all the figures showing the exact inclusions, the orange color represents an inhomogeneity associated with , whereas the blue color represents an inhomogeneity associated with .
6.1 Numerical tests on appropriate choices of boundary influxes and Sobolev index
We start first with an illustrative example to demonstrate the effectiveness of the decoupling strategy we proposed in section 5.3 for choosing boundary influxes with different frequencies and the necessity of choosing a non-zero Sobolev scale that appears in the index functions (4.8) and (4.9). We pick us a toy example, Example 1, that contains two inhomogeneous inclusions, arising from and , respectively. With boundary influxes of different frequencies, we compare the indices and . This helps us develop an appropriate choice of two frequencies for boundary influxes for the use in all the subsequent evaluations of the monopole and the dipole index functions.
Example 1. This example contains two different types of inhomogeneities: an inhomogeneity with located at the disk centered at with radius , and another inhomogeneity with located at the disk centered at with radius . We apply the boundary influxes of two different frequencies, , , and show their index functions and in Figs. 10(b) and 10(c). We can see, as the frequency of the boundary influx increases, the reconstruction by of the inhomogeneity with located at left becomes more and more apparent, while the reconstruction by of the inhomogeneity with located at right disappears eventually. Fig. 10 shows the reconstructions with Sobolev index , from which we can see the reconstructions are much less sharp than the ones with . Therefore a non-zero is essential for a sharper reconstruction.
Similar numerical effects with the boundary influxes of different frequencies have been observed in many experiments. Therefore we will present in all subsequent examples only two measurement events. The first measurement is taken with a boundary influx of low frequency, i.e., , with which we calculate ; the second measurement is taken with a boundary influx of high frequency, with which we compute .


6.2 Decoupled reconstructions via the monopole and dipole index functions and appropriate choices of boundary influxes
We are going to present three representative examples for reconstructing two types of inhomogeneities with appropriate choices of boundary influxes based on the strategy we proposed in section 6.1. In all our reconstructions for these examples, we do not assume any prior knowledge of the shapes, locations and ranges of values of the unknown inhomogeneous coefficients and .
Example 2. In this example, we consider a medium with three inhomogeneities as indicated in Fig. 11. As we see, there are two inhomogeneities correspond to the potential , located at two disks centered at and with radius , respectively, and there is another inhomogeneity corresponding to the conductivity , located at the disk centered at with radius . In Fig. 11, we have plotted the monopole index associated with the boundary influx , and the dipole index associated with the boundary influx . As one can see from Fig. 11, the two different types of inhomogeneities are decoupled: shows the inhomogeneities with , while shows the inhomogeneity with . It is surprising that even when the two types of inhomogeneities (both residing in the left part of ) are very close to each other, the DSM could still separate them clearly.


Example 3. This is a more challenging example with four inhomogeneous inclusions as shown in Fig. 12. As we see from the figure, there are two inhomogeneities corresponding to the conductivity , located at two disks centered at and with radius , respectively; meanwhile there are two other inhomogeneities corresponding to the potential , located at two disks centered at and with radius , respectively. Fig. 12 shows the monopole index associated with the boundary influx and the dipole index associated with the boundary influx . The numerical reconstructions demonstrated the two different types of inhomogeneities are well separated: recovers two inhomogeneities corresponding to , while recovers two inhomogeneities corresponding to . This shows clearly the success of the DSM in decoupling the measurement data, locate two different types of inhomogeneous inclusions and distinguish their types quite reasonably.


Example 4. This example shows a medium with four inhomogeneous inclusions as in Fig. 13. We see three conductivity inhomogeneities with placed at three disks centered at , , and with radius , and one potential inhomogeneity with placed at the disk centered at with radius . Fig. 13 plots the monopole index with the boundary influx and the dipole index with the boundary influx . This example is quite surprising to see a satisfactory separation of the conductivity inhomogeneous inclusions from the potential inhomogeneities although the number of the former is three times of the latter. We can further improve the sharpness of when the data is collected at more measurement points.


7 Concluding remarks
We have proposed a novel direct sampling method for simultaneously reconstructing two different types of inhomogeneities inside a domain with boundary measurements collected from only one or two measurement events. This inverse problem is theoretically known to have no uniqueness in most cases, and is highly unstable and ill-posed.
A main feature of the new method is to design two distinct sets of probing functions, i.e., the monopole and dipole probing functions, which help decouple the respective signals coming from the monopole-type and dipole-type sources located in the sampling domain. Each type of sources carries the information of one distinctive type of inhomogeneity we aim to reconstruct. This enables us to decouple the boundary measurements and achieve reasonable simultaneous reconstructions. The direct sampling method relies on two index functions that can be computed in a fast, stable and highly parallel manner. Numerical experiments have illustrated its stability in decomposing different signals coming from two types of inhomogeneities in measurement data, and its robustness against noise.
Our choice of the model inverse problem covers a general class of inverse coefficients problems that we encountered in applications, for instance, diffusion-based optical tomography, inverse electromagnetic scattering problem under transverse symmetry and ultrasound medical imaging. A very unique feature of the new method is its applications to the important scenarios when very limited data is available, e.g., only the data from one or two measurement event, to which most existing methods are not applicable.
Along this research topic, there are some interesting and important directions that deserve further exploration: extend the sampling method to a broader class of coefficients inverse problems with more complicated interaction terms, for instance, anisotropic electromagnetic scattering, fully anisotropic linear and nonlinear elasticity model, shallow water wave equation, Boltzmann transport equation, Klein-Gordon and Sine-Gordon equations, etc.; develop a unified framework of the direct sampling methods, with a concrete recipe for generating optimal probing functions and duality products for a given inverse problem.
References
- [1] M. Abramowitz and I. A. Stegun, Handbook of Mathematical Functions with Formulas, Graphs, and Mathematical Tables, Dover, 1965.
- [2] H. Ammari, J. Garnier, V. Jugnon, and H. Kang, Direct reconstruction methods in ultrasound imaging of small anomalies, vol. 2035 of Lecture Notes in Math., Springer, Berlin, Heidelberg, 2011, pp. 31–55.
- [3] H. Ammari, J. Garnier, V. Jugnon, and H. Kang, Stability and resolution analysis for a topological derivative based imaging functional, SIAM J. Control Optim., 50 (2012), pp. 48–76.
- [4] H. Ammari, E. Iakovleva, and H. Kang, Reconstruction of a small inclusion in a two-dimensional open waveguide, SIAM J. Appl. Math., 65 (2005), pp. 2107–2127.
- [5] S. R. Arridge, Optical tomography in medical imaging, Inverse problems, 15 (1999), pp. R41–R93.
- [6] S. R. Arridge and W. R. Lionheart, Nonuniqueness in diffusion-based optical tomography, Opt. Lett., 23 (1998), pp. 882–884.
- [7] L. Beilina, M. Cristofol, and K. Niinimäki, Optimization approach for the simultaneous reconstruction of the dielectric permittivity and magnetic permeability functions from limited observations, Inverse Probl. Imaging, 9 (2015), pp. 1–25.
- [8] C. Bellis, M. Bonnet, and F. Cakoni, Acoustic inverse scattering using topological derivative of far-field measurements-basedl2cost functionals, Inverse Problems, 29 (2013), 075012.
- [9] F. Cakoni, D. Colton, and P. Monk, The linear sampling method in inverse electromagnetic scattering, SIAM, Philadelphia, 2011.
- [10] J. Chen, Z. Chen, and G. Huang, Reverse time migration for extended obstacles: acoustic waves, Inverse Problems, 29 (2013), 085005.
- [11] X. Chen, Computational methods for electromagnetic inverse scattering, Wiley-IEEE Press, 2018.
- [12] Y. T. Chow, K. Ito, K. Liu, and J. Zou, Direct sampling method for diffusive optical tomography, SIAM J. Sci. Comput., 37 (2015), pp. A1658–A1684.
- [13] Y. T. Chow, K. Ito, and J. Zou, A direct sampling method for electrical impedance tomography, Inverse Problems, 30 (2014), 095003.
- [14] Y. T. Chow, K. Ito, and J. Zou, A time-dependent direct sampling method for recovering moving potentials in a heat equation, SIAM J. Sci. Comput., 40 (2018), pp. A2720–A2748.
- [15] D. Colton and A. Kirsch, A simple method for solving inverse scattering problems in the resonance region, Inverse Problems, 12 (1996), pp. 383–393.
- [16] D. Colton and R. Kress, Inverse acoustic and electromagnetic scattering theory, vol. 93 of Applied Mathematical Sciences, Springer-Verlag, New York, 4 ed., 2019.
- [17] O. Dorn, A transport-backtransport method for optical tomography, Inverse Problems, 14 (1998), pp. 1107–1130.
- [18] O. Dorn and D. Lesselier, Level set methods for inverse scattering, Inverse Problems, 22 (2006), pp. R67–R131.
- [19] T. Durduran, R. Choe, W. B. Baker, and A. G. Yodh, Diffuse optics for tissue monitoring and tomography, Rep. Prog. Phys., 73 (2010), 076701.
- [20] A. El Badia and T. Ha-Duong, An inverse source problem in potential analysis, Inverse Problems, 16 (2000), pp. 651–663.
- [21] A. Hannukainen, L. Harhanen, N. Hyvönen, and H. Majander, Edge-promoting reconstruction of absorption and diffusivity in optical tomography, Inverse Problems, 32 (2015), 015008.
- [22] D. J. Hansen and M. S. Vogelius, High frequency perturbation formulas for the effect of small inhomogeneities, J. Phys. Conf. Ser., 135 (2008), 012106.
- [23] B. Harrach, On uniqueness in diffuse optical tomography, Inverse Problems, 25 (2009), 055010.
- [24] K. Ito, B. Jin, and J. Zou, A direct sampling method to an inverse medium scattering problem, Inverse Problems, 28 (2012), 025003.
- [25] S. Kang, M. Lambert, and W.-K. Park, Direct sampling method for imaging small dielectric inhomogeneities: analysis and improvement, Inverse Problems, 34 (2018), 095005.
- [26] A. Kirsch, Factorization of the far-field operator for the inhomogeneous medium case and an application in inverse scattering theory, Inverse Problems, 15 (1999), pp. 413–429.
- [27] A. Kirsch, The music-algorithm and the factorization method in inverse scattering theory for inhomogeneous media, Inverse Problems, 18 (2002), pp. 1025–1040.
- [28] A. Kirsch and N. Grinberg, The Factorization Method for Inverse Problems, Oxford University Press, Oxford, 2008.
- [29] V. Kolehmainen, S. Arridge, W. Lionheart, M. Vauhkonen, and J. Kaipio, Recovery of region boundaries of piecewise constant coefficients of an elliptic pde from boundary data, Inverse Problems, 15 (1999), pp. 1375–1391.
- [30] K. H. Leem, J. Liu, and G. Pelekanos, Two direct factorization methods for inverse scattering problems, Inverse Problems, 34 (2018), 125004.
- [31] J. Li and J. Zou, A direct sampling method for inverse scattering using far-field data, Inverse Probl. Imaging, 7 (2013), pp. 757–775.
- [32] X. Liu, A novel sampling method for multiple multiscale targets from scattering amplitudes at a fixed frequency, Inverse Problems, 33 (2017), 085011.
- [33] L. Novotny and B. Hecht, Principles of Nano-Optics, Cambridge University Press, 2006.
- [34] R. Potthast, Point sources and multipoles in inverse scattering theory, Chapman and Hall, 2001.
- [35] R. Potthast, A survey on sampling and probe methods for inverse problems, Inverse Problems, 22 (2006), pp. R1–R47.
- [36] R. Potthast, A study on orthogonality sampling, Inverse Problems, 26 (2010), 074015.
- [37] L. W. Schmerr, Fundamentals of ultrasonic nondestructive evaluation, Springer, New York, 2016.
- [38] J. Sylvester and G. Uhlmann, The Dirichlet to Neumann map and applications, in Inverse Problems in Partial Differential Equations, SIAM, Philadelphia, 1990, pp. 101–139.
- [39] M. S. Vogelius and D. Volkov, Asymptotic formulas for perturbations in the electromagnetic fields due to the presence of inhomogeneities of small diameter, Math. Model. Numer. Anal., 34 (2000), pp. 723–748.
- [40] C. Wang, An EM-like reconstruction method for diffuse optical tomography, Int. J. Numer. Meth. Biomed. Engng., 26 (2010), pp. 1099–1116.
- [41] M. Zhdanov, Inverse Theory and Applications in Geophysics, Elsevier Science, Amsterdam, 2015.