A Cheap Bootstrap Method for Fast Inference
Abstract
The bootstrap is a versatile inference method that has proven powerful in many statistical problems. However, when applied to modern large-scale models, it could face substantial computation demand from repeated data resampling and model fitting. We present a bootstrap methodology that uses minimal computation, namely with a resample effort as low as one Monte Carlo replication, while maintaining desirable statistical guarantees. We present the theory of this method that uses a twisted perspective from the standard bootstrap principle. We also present generalizations of this method to nested sampling problems and to a range of subsampling variants, and illustrate how it can be used for fast inference across different estimation problems.
1 Introduction
The bootstrap is a versatile method for statistical inference that has proven powerful in many problems. It is advantageously data-driven and automatic: Instead of using analytic calculation based on detailed model knowledge such as the delta method, the bootstrap uses resampling directly from the data as a mechanism to approximate the sampling distribution. The flexibility and ease of the bootstrap have made it widely popular; see, e.g., the monographs Efron and Tibshirani (1994); Davison and Hinkley (1997); Shao and Tu (2012); Hall and Martin (1988) for comprehensive reviews on the subject.
Despite its popularity, an arguable challenge in using the bootstrap is its computational demand. To execute the bootstrap, one needs to run enough Monte Carlo replications to generate resamples and refit models. While this is a non-issue in classical problems, for modern large-scale models and data size, even one model refitting could incur substantial costs. This is the case if the estimation or model fitting involves big optimization or numerical root-finding problems arising from, for instance, empirical risk minimization in machine learning, where the computing routine can require running time-consuming stochastic gradient descent or advanced mathematical programming procedures. Moreover, in these problems, what constitutes an adequate Monte Carlo replication size can be case-by-case and necessitate trial-and-error, which adds to the sophistication. Such computation issues in applying resampling techniques to massive learning models have been discussed and motivate some recent works, e.g., Kleiner et al. (2012); Lu et al. (2020); Giordano et al. (2019); Schulam and Saria (2019); Alaa and Van Der Schaar (2020).
Moreover, an additional challenge faced by the bootstrap is that its implementation can sometimes involve a nested amount of Monte Carlo runs. This issue arises for predictive models that are corrupted by noises from both the data and the computation procedure. An example is predictive inference using high-fidelity stochastic simulation modeling (Nelson (2013); Law et al. (1991)). These models are used to estimate output performance measures in sophisticated systems, and comprises a popular approach for causal decision-making in operations management and scientific disciplines. In this context, obtaining a point estimate of the performance measure itself requires a large number of Monte Carlo runs on the model to average out the aleatory uncertainty. When the model contains parameters that are calibrated from exogenous data, conducting bootstrap inference on the prediction would involve first resampling the exogenous data, then given each resampled input parameter value, running and averaging a large number of model runs. This consequently leads to a multiplicative total computation effort between the resample size and the model run size per resample, an issue known as the input uncertainty problem in simulation (see, e.g., Henderson (2003); Song et al. (2014); Barton (2012); Lam (2016)). Here, to guarantee consistency, the sizes in the two sampling layers not only need to be sufficiently large, but also depend on the input data size which adds more complication to their choices (Lam and Qian (2021)). Other than simulation modeling, similar phenomenon arises in some machine learning models. For example, a bagging predictor (Breiman (1996); Wager et al. (2014); Mentch and Hooker (2016)) averages a large number of base learning models each trained from a resample, and deep ensemble (Lakshminarayanan et al. (2016); Lee et al. (2015)) averages several neural networks each trained with a different randomization seed (e.g., in initializing a stochastic gradient descent). Running bootstraps for the prediction values of these models again requires a multiplicative effort of data resampling and, given each resample, building a new predictor which requires multiple training runs.
Motivated by these challenges, our goal in this paper is to study a statistically valid bootstrap method that allows using very few resamples. More precisely, our method reduces the number of bootstrap resamples to the minimum possible, namely as low as one Monte Carlo replication, while still delivering asymptotically exact coverage as the data size grows. This latter guarantee holds under essentially the same regularity conditions for conventional bootstrap methods. As a result, our method can give valid inference under constrained budget when existing bootstrap approaches fail. Moreover, the validity of our inference under any number of resamples endows more robustness, and hence alleviates the tuning effort, in choosing the number of resamples, which as mentioned before could be a trial-and-error task in practice. For convenience, we call our method the Cheap Bootstrap, where “Cheap” refers to our low computation cost, and also to the correspondingly lower-quality half-width performance when using the low cost as we will see.
In terms of theory, the underpinning mechanism of our Cheap Bootstrap relies on a simple twist to the basic principle used in conventional bootstraps. The latter dictates that the sampling distribution of a statistic can be approximated by the resample counterpart, conditional on the data. To utilize this principle for inference, one then typically generates many resample estimates to obtain their approximate distribution. Our main idea takes this principle a step further by leveraging the following: The resemblance of the resampling distribution to the original sampling distribution, universally regardless of the data realization, implies the asymptotic independence between the original estimate and any resample estimate. Thus, under asymptotic normality, we can construct pivotal statistics using the original estimate and any number of resample estimates that cancel out the standard error as a nuisance parameter, which subsequently allows us to conduct inference using as low as one resample.
In addition to the basic asymptotic exact coverage guarantee, we study Cheap Bootstrap in several other aspects. First regards the half-width of the Cheap Bootstrap confidence interval, a statistical efficiency measure in addition to coverage performance. We show how the Cheap Bootstrap interval follows the behavior of a -interval, which is wide when we use only one resample but shrinks rapidly as the number of resamples increases. Second, we investigate the higher-order coverage of Cheap Bootstrap via Edgeworth expansions. Different from conventional bootstrap procedures, the Cheap Bootstrap pivotal statistic has a limiting -distribution, not a normal distribution. Edgeworth expansion on -distribution is, to our best knowledge, open in the literature (except the recent working paper He and Lam (2021)). Here, we build the Edgeworth expansions for Cheap Bootstrap coverage probabilities and show their errors match the order (where is the sample size) incurred in conventional bootstraps in the two-sided case. Moreover, we explicitly identify the coefficient in this error term, which is expressible as a high-dimensional integral that, although cannot be evaluated in closed-form, is amenable to Monte Carlo integration.
We also generalize the Cheap Bootstrap in several directions. First, we devise the Cheap Bootstrap confidence intervals for models that encounter both data and computation noises and hence the aforementioned nested sampling issue. When applying the Cheap Bootstrap to these problems, the number of outer resamples can be driven down to one or a very small number, and thus the total model run size is no longer multiplicatively big. On the other hand, because of the presence of multiple sources of noises, the joint distribution between the original estimate and the resample estimate is no longer asymptotically independent, but exhibits a dependent structure that nonetheless could be tractably exploited. Second, our Cheap Bootstrap can also be used in conjunction with “subsampling” variants. By subsampling here we broadly refer to schemes that resample data sets of size smaller than the original size, such as the -out-of- Bootstrap (Politis et al. (1999); Bickel et al. (1997)), and more recently the Bags of Little Bootstraps (Kleiner et al. (2014)) and Subsampled Double Bootstrap (Sengupta et al. (2016)). We show how these procedures can all be implemented “cheaply”. Finally, we also extend the Cheap Bootstrap to multivariate problems.
We close this introduction by discussing other related works. Regarding motivation, our study appears orthogonal to most of the classical bootstrap literature, as its focus is on higher-order coverage accuracy, using techniques such as studentization (Davison and Hinkley (1997) §2.4), calibration or iterated bootstrap (Hall (2013) §3.11; Hall and Martin (1988); Hall (1986a); Beran (1987)), and bias-correction and acceleration (Efron (1982) §10.4; Efron (1987); DiCiccio et al. (1996)). The literature also studies the relaxation of assumptions to handle non-smooth functions and dependent data (Politis et al. (1999); Bickel et al. (1997)). In contrast to these studies, we focus on the capability to output confidence intervals under extremely few resamples, and the produced intervals are admittedly less accurate than the refined intervals in the literature constructed under idealized infinite resamples.
Our study is related to Hall (1986b), which shows a uniform coverage error of for one-sided intervals regardless of the number of resamples , as long as the nominal coverage probability is a multiple of . From this, Hall (1986b) suggests, for interval for instance, that it suffices to use to obtain a reasonable coverage accuracy. Our suggestion in this paper drives this number down to , which is made possible via our use of asymptotic independence and normality instead of order-statistic analyses on the quantile-based bootstrap in Hall (1986b). Our result on a small resulting in a large interval width matches the insight in Hall (1986b), though we make this tradeoff more explicit by looking at the width’s moments. Other related works on bootstrap computation cost include Booth and Hall (1994) and Lee and Young (1995) that analyze or reduce Monte Carlo sizes by replacing sampling with analytical calculation when applying the iterated bootstrap, and Booth and Do (1993) and Efron and Tibshirani (1994) §23 on variance reduction. These works, however, do not consider the exceedingly low number of resamples that we advocate in this paper.
The remainder of this paper is as follows. Section 2 introduces the Cheap Bootstrap. Section 3 presents the main theoretical results on asymptotic exactness and higher-order coverage error, and discusses half-width behaviors. Section 4 generalizes the Cheap Bootstrap to nested sampling problems, and Section 5 to subsampling. Section 6 shows numerical results to demonstrate our method and compare with benchmarks. The Appendix details proofs that are not included in the main body, presents additional theoretical and numerical results, and documents some technical background materials.
2 Cheap Bootstrap Confidence Intervals
We aim to construct a confidence interval for a target parameter , where is the data distribution, and is a functional with as the set of all distributions on the data domain. This can range from simple statistical summaries such as correlation coefficient, quantile, conditional value-at-risk, to model parameters such as regression coefficient and prediction error measurement.
Suppose we are given independent and identically distributed (i.i.d.) data of size , say . A natural point estimate of is , where is the empirical distribution constructed from the data, and denotes the indicator function.
Our approach to construct a confidence interval for proceeds as follows. For each replication , we resample the data set, namely independently and uniformly sample with replacement from times, to obtain , and evaluate the resample estimate , where is the resample empirical distribution. Our confidence interval is
| (1) |
where
| (2) |
Here, resembles the sample variance of the resample estimates, but “centered” at the original point estimate instead of the resample mean, and using in the denominator instead of as in “textbook” sample variance. The critical value is the -quantile of , the student -distribution with degree of freedom . That is, the degree of freedom of this -distribution is precisely the resampling computation effort.
The interval in (1) is defined for any positive integer . In particular, when , it becomes
| (3) |
where is the single resample estimate.
The form of (1) looks similar to the so-called standard error bootstrap as we explain momentarily, especially when is large. However, the point here is that does not need to be large. In fact, we have the following basic coverage guarantee for (1) and (3). First, consider the following condition that is standard in the bootstrap literature:
Assumption 1 (Standard condition for bootstrap validity).
We have where . Moreover, a resample estimate satisfies conditional on the data in probability as .
In Assumption 1, “” denotes convergence in distribution, and the conditional “”-convergence in probability means for any , where “” denotes convergence in probability. Assumption 1 is a standard condition to justify bootstrap validity, and is ensured when is Hadamard differentiable (see Proposition 2 in the sequel which follows from Van der Vaart (2000) §23). This assumption implies that, conditional on the data, the asymptotic distributions of the centered resample estimate and the centered original estimate are the same. Thus, one can use the former distribution, which is computable via Monte Carlo, to approximate the latter unknown distribution. Simply put, we can use a “plug-in” of in place of , namely , to approximate for any suitable data-dependent quantity .
Theorem 1 (Asymptotic exactness of Cheap Bootstrap).
Theorem 1 states that, under the same condition to justify the validity of conventional bootstraps, the Cheap Bootstrap interval has asymptotically exact coverage, for resample effort as low as 1. Before we explain how Theorem 1 is derived, we first compare the Cheap Bootstrap to conventional bootstraps.
2.1 Comparisons with Established Bootstrap Methods
The commonest bootstrap approach for interval construction uses the quantiles of resample estimates to calibrate the interval limits. This includes the basic bootstrap and (Efron’s) percentile bootstrap (Efron and Tibshirani (1994); Davison and Hinkley (1997)). In the basic bootstrap, we first run Monte Carlo to approximate the and -quantiles of , say and . Assumption 1 guarantees that and approximate the corresponding quantiles of , thus giving as a confidence interval for (or equivalently using the and quantiles of ). The percentile bootstrap directly uses the and -quantiles of as the interval limits, i.e., , justified by additionally the symmetry of the asymptotic distribution. Alternately, one can bootstrap the standard error and plug into a normality confidence interval (Efron (1981)). That is, we compute to approximate (where and denote respectively the variance with respect to the data and the conditional variance with respect to a resample drawn from ), and output as the confidence interval, with being the -quantile of standard normal.
All approaches above require generating enough resamples. When is large, the defined in (2) satisfies , and moreover . Thus in this case the Cheap Bootstrap interval becomes , which is nothing but the standard error bootstrap. In other words, the Cheap Bootstrap can be viewed as a generalization of the standard error bootstrap to using any .
We also contrast our approach with the studentized bootstrap (e.g., Davison and Hinkley (1997) §2.4), which resamples pivotal quantities in the form where is a sample standard error (computed from ). As widely known, while this approach bears the term “studentized”, it does not use the -distribution, and is motivated from better higher-order coverage accuracy. Moreover, attaining such an interval could require additional computation to resample the standard error. Our approach is orthogonal to this studentization in that we aim to minimize computation instead of expanding it for the sake of attaining higher-order accuracy.
Lastly, (1) and (3) have natural analogs for one-sided intervals, where we use
| (4) |
Theorem 1 applies to (4) under the same assumption. In the one-sided case, Hall (1986b) has shown an error of , uniformly in , for the studentized bootstrap when the nominal coverage probability is a multiple of . This translates, in the case of interval, a minimum of . Our Theorem 1 drives down this suggestion of Hall (1986b) for the studentized bootstrap to for the Cheap Bootstrap.
2.2 A Basic Numerical Demonstration
We numerically compare our Cheap Bootstrap with the conventional approaches, namely the basic bootstrap, percentile bootstrap and standard error bootstrap described above. We use a basic example on estimating a confidence interval of the -quantile of, say, an exponential distribution with unit rate from i.i.d. data. This example can be handled readily by other means, but it demonstrates how Cheap Bootstrap can outperform baselines under limited replication budget.
We use a data size , and vary . For each , we generate synthetic data times, each time running all the competing methods, and outputting the empirical coverage and interval width statistics from the experimental repetitions. Table 1 shows that when , Cheap Bootstrap already gives confidence intervals with a reasonable coverage of , while all other bootstrap methods fail because they simply cannot operate with only one resample (basic and percentile bootstraps cannot output two different finite numbers as the upper and lower interval limits, and standard error bootstrap has a zero denominator in the formula). When , all baseline methods still have poor performance, as is clearly still too small a size to possess any statistical guarantees. In contrast, Cheap Bootstrap gives a similar coverage of as in , and continues to have stable coverages when increases. As increases through 5 to 50, the baseline methods gradually catch up on the coverage level.
| Replication | Empirical coverage | Width mean | |
|---|---|---|---|
| size | (margin of error) | (standard deviation) | |
| Cheap Bootstrap | 1 | 0.92 (0.02) | 2.42 (2.06) |
| Basic Bootstrap | 1 | NA | NA |
| Percentile Bootstrap | 1 | NA | NA |
| Standard Error Bootstrap | 1 | NA | NA |
| Cheap Bootstrap | 2 | 0.93 (0.02) | 0.95 (0.60) |
| Basic Bootstrap | 2 | 0.32 (0.03) | 0.14 (0.12) |
| Percentile Bootstrap | 2 | 0.32 (0.03) | 0.14 (0.12) |
| Standard Error Bootstrap | 2 | 0.67 (0.03) | 0.38 (0.33) |
| Cheap Bootstrap | 5 | 0.92 (0.02) | 0.63 (0.28) |
| Basic Bootstrap | 5 | 0.62 (0.03) | 0.29 (0.14) |
| Percentile Bootstrap | 5 | 0.69 (0.03) | 0.29 (0.14) |
| Standard Error Bootstrap | 5 | 0.86 (0.02) | 0.47 (0.22) |
| Cheap Bootstrap | 10 | 0.92 (0.02) | 0.53 (0.20) |
| Basic Bootstrap | 10 | 0.73 (0.03) | 0.37 (0.14) |
| Percentile Bootstrap | 10 | 0.80 (0.02) | 0.37 (0.14) |
| Standard Error Bootstrap | 10 | 0.88 (0.02) | 0.46 (0.17) |
| Cheap Bootstrap | 50 | 0.94 (0.02) | 0.50 (0.13) |
| Basic Bootstrap | 50 | 0.86 (0.02) | 0.44 (0.12) |
| Percentile Bootstrap | 50 | 0.92 (0.02) | 0.44 (0.12) |
| Standard Error Bootstrap | 50 | 0.93 (0.02) | 0.48 (0.13) |
Regarding interval length, we see that the Cheap Bootstrap interval shrinks as increases, sharply for small and then stabilizes. In particular, the length decreases by when increases from 1 to 2, compared to a much smaller when increases from 10 to 50. Though the length of Cheap Bootstrap is always larger than the baselines, it closes in at and even more so at . Both the good coverage starting from for Cheap Bootstrap, and the sharp decrease of its interval length at very small and then level-off will be explained by our theory next.
3 Theory of Cheap Bootstrap
We describe the theory of Cheap Bootstrap, including its asymptotic exactness (Section 3.1), higher-order coverage error (Section 3.2) and interval width behavior (Section 3.3).
3.1 Asymptotic Exactness
We present the proof of Theorem 1 on the asymptotic exactness of Cheap Bootstrap for any . The first key ingredient is the following joint asymptotic characterization among the original estimate and the resample estimates:
Proposition 1 (Asymptotic independence and normality among original and resample estimates).
Under Assumption 1, we have, for the original estimate and resample estimates ,
| (5) |
where are i.i.d. variables.
The convergence (5) entails that, under -scaling, the centered resample estimates and the original point estimate are all asymptotically independent, and moreover are distributed according to the same normal, with the only unknown being that captures the asymptotic standard error. The asymptotic independence is thanks to the universal limit of a resample estimate conditional on any data sequence, as detailed below.
Proof of Proposition 1.
Denote as the distribution function of . To show the joint weak convergence of and , , to i.i.d. variables, we will show, for any ,
as . To this end, we have
| (6) | |||||
| since for are independent conditional on the data | |||||
| by the triangle inequality | |||||
Now, by Assumption 1, we have for , and thus . Hence, since and are bounded by 1, the first term in (6) converges to 0 by the bounded convergence theorem. The second term in (6) also goes to 0 because by Assumption 1 again. Therefore (6) converges to 0 as . ∎
Given Proposition 1, to infer we can now leverage classical normality inference tools to “cancel out” the nuisance parameter . In particular, we can use the pivotal statistic
| (7) |
where is as defined in (2), which converges to a student -distribution with degree of freedom . More concretely:
Proof of Theorem 1.
The pivotal statistic (7) satisfies
| (8) |
for i.i.d. variables , where we use Proposition 1 and the continuous mapping theorem to deduce the weak convergence. Note that
where and here represent standard normal and random variables. Here the two equalities in distribution (denoted “”) follow from the elementary constructions of - and -distributions respectively. Thus
Hence we have
from which we conclude
and the theorem. ∎
Note that instead of using the -statistic approach, it is also possible to produce intervals from the normal variables in other ways (e.g., Wall et al. (2001)) which could have potential benefits for very small . However, the -interval form of (1) is intuitive, matches the standard error bootstrap as grows, and its width is easy to quantify.
In Theorem 1 we have used Assumption 1. This assumption is ensured when the functional is Hadamard differentiable with a non-degenerate derivative. More precisely, for a class of functions from , define where is a map from to . We have the following:
Proposition 2 (Sufficient conditions for bootstrap validity).
Consider and as random elements that take values in , where is a Donsker class with finite envelope. Suppose is Hadamard differentiable at (tangential to ) where the derivative satisfies that is a non-degenerate random variable (i.e., with positive variance), for a tight Gaussian process on with mean 0 and covariance (where denotes the covariance taken with respect to ). Then Assumption 1 holds under i.i.d. data.
Proposition 2 follows immediately from the functional delta method (see Van der Vaart (2000) §23 or Appendix F.2). Note that we may as well use the conditions in Proposition 2 as the assumption for Theorem 1, but Assumption 1 helps highlight our point that Cheap Bootstrap is valid whenever conventional bootstraps are.
3.2 Higher-Order Coverage Errors
We analyze the higher-order coverage errors of Cheap Bootstrap. A common approach to analyze coverage errors in conventional bootstraps is to use Edgeworth expansions, which we will also utilize. However, unlike these existing methods, the pivotal statistic used in Cheap Bootstrap has a limiting -distribution, not a normal distribution. Edgeworth expansions on limiting -distributions appear open to our best knowledge (except a recent working paper He and Lam (2021)). Here, we derive our expansions for Cheap Bootstrap by integrating the expansions of the original estimate and resample estimates that follow (conditional) asymptotic normal distributions. The resulting coefficients can be explicitly identified which, even though cannot be evaluated in closed-form, are amenable to Monte Carlo integration.
As is customary in the bootstrap literature, we consider the function-of-mean model, namely , where for a -dimensional random vector and is a function. Denote as the sample mean of i.i.d. data . To facilitate our discussion, define
| (9) |
for function , where is the asymptotic variance of that can be written in terms of by the delta method (under regularity conditions that will be listed explicitly in our following theorem). To be more precise on the latter point, note that given any , we can augment it to , with the operation defined component-wise (viewing as column vector). Thus, for a given , we can define and , where is the covariance matrix which is a function of , and denotes transpose.
We also define the “studentized” version of given by
| (10) |
We have the following:
Theorem 2 (Higher-order coverage errors for Cheap Bootstrap).
Consider the function-of-mean model where for some function and for a -dimensional random vector . Consider also the function that appears in (9). Assume that and each has bounded derivatives in a neighborhood of , that for a sufficiently large positive number , and that the characteristic function of satisfies Cramer’s condition . Then
-
1.
When , the two-sided Cheap Bootstrap confidence interval satisfies
where the coefficient
-
2.
When , the one-sided upper Cheap Bootstrap confidence interval satisfies
where the coefficient
and the one-sided lower Cheap Bootstrap confidence interval satisfies
where the coefficient
In the above, and are the standard normal distribution and density functions respectively, and are polynomials of degree , odd for even and even for odd , with coefficients depending on moments of up to order polynomially and also and .
In Theorem 2, the polynomials and are related to and defined in (9) and (10) as follows. Under the assumptions in the theorem, the -th cumulant of and can be expanded as
for coefficients ’s depending on whether we are considering or . Then or is equal to
while or is equal to
Here is the -th order Hermite polynomial, and ’s are determined from for and determined from for .
The coverage error of the Cheap Bootstrap in the two-sided case and in the one-sided case in Theorem 2 match the conventional basic and percentile bootstraps described in Section 2.1. Nonetheless, these errors are inferior to more refined approaches, including the studentized bootstrap also mentioned earlier which attains in the one-sided case (Davison and Hinkley (1997)).
Theorem 2 is proved by expressing the distribution of the pivotal statistic in (7) as a multi-dimensional integral, with respect to measures that are approximated by the Edgeworth expansions of the original estimate and the conditional expansions of the resample estimates which have limiting normal distributions. From these expansions, we could also identify the polynomials and in our discussion above by using equations (2.20), (2.24) and (2.25) in Hall (2013). Lastly, we note that the remainder term in the coverage of the two-sided confidence interval in Theorem 2 can be refined to when , and the one-sided intervals can be refined to when . These can be seen by tracing our proof (in Appendix B).
The coefficients , and are computable via Monte Carlo integration, because integral in the form
for some set and polynomial can be written as
which is expressible as an expectation
taken with respect to independent standard normal variables .
3.3 Interval Tightness
Besides coverage, another important efficiency criterion is the interval width. From Section 3.1, we know that the Cheap Bootstrap interval (1) arises from a -interval construction, using which we can readily extract its width behavior. More specifically, for a fixed number of resamples , satisfies
as so that the half-width of is . Plugging in the moments of , we see that the half-width for large sample size has mean and variance given by
| (11) | ||||
| (12) |
respectively, where is the Gamma function. As increases, both the mean and variance decrease, which signifies a natural gain in statistical efficiency, until in the limit we get a mean and a variance 0, which correspond to the normality interval with a known .
The expressions (11) and (12) reveal that the half-width of Cheap Bootstrap is large when , but falls and stabilizes quickly as increases. Table 2 shows the approximate half-width mean and standard deviation shown in (11) and (12) at (ignoring the factor), and the relative inflation in mean half-width compared to the case (i.e., . We see that, as increases from 1 to 2, the half-width mean drops drastically from ( inflation relative to ) to ( inflation), and half-width standard deviation from to . As increases from 2 to 3, the mean continues to drop notably to ( inflation) and standard deviation to . The drop rate slows down as increases further. For instance, at the mean is ( inflation) and standard deviation is , while at the mean is ( inflation) and standard deviation is . Though what constitutes an acceptable inflation level compared to is context-dependent, generally the inflation appears reasonably low even when is a small number, except perhaps when is or .
| Replication | Mean (ignoring | Mean inflation relative | Standard deviation (ignoring |
|---|---|---|---|
| size | the factor) | to () | the factor) |
| 1 | 10.14 | 417.3% | 7.66 |
| 2 | 3.81 | 94.6% | 1.99 |
| 3 | 2.93 | 49.6% | 1.24 |
| 4 | 2.61 | 33.2% | 0.95 |
| 5 | 2.45 | 24.8% | 0.79 |
| 6 | 2.35 | 19.8% | 0.69 |
| 7 | 2.28 | 16.4% | 0.62 |
| 8 | 2.24 | 14.0% | 0.57 |
| 9 | 2.20 | 12.3% | 0.53 |
| 10 | 2.17 | 10.9% | 0.49 |
| 11 | 2.15 | 9.8% | 0.46 |
| 12 | 2.13 | 8.9% | 0.44 |
| 13 | 2.12 | 8.1% | 0.42 |
| 14 | 2.11 | 7.5% | 0.40 |
| 15 | 2.10 | 7.0% | 0.39 |
| 16 | 2.09 | 6.5% | 0.37 |
| 17 | 2.08 | 6.1% | 0.36 |
| 18 | 2.07 | 5.7% | 0.35 |
| 19 | 2.07 | 5.4% | 0.34 |
| 20 | 2.06 | 5.1% | 0.33 |
In Appendices A.1 and A.2, we discuss inference on standard error and a multivariate version of the Cheap Bootstrap, which are immediate extensions of our developments in this section. In the next two sections, we discuss two generalizations of our approach to models corrupted by both data and computation noises (Section 4) and to subsampling (Section 5).
4 Applying Cheap Bootstrap to Nested Sampling Problems
Our Cheap Bootstrap can reduce computational cost for problems which, when applying the conventional bootstraps, require nested sampling. This phenomenon arises when the estimate involves noises coming from both the data and computation procedure. To facilitate discussion, as in Section 2, denote as a target parameter or quantity of interest. However, here the computation of , for any given , could be noisy. More precisely, suppose that, given any , we could only generate where is an unbiased output for . Then, to compute a point estimate of , we use the data to construct the empirical distribution , and with this , we output
| (13) |
where , is a sequence of unbiased runs for , independent given . The “double hat” above in the left hand side of (13) signifies the two sources of noises, one from the estimation of and one from the estimation of , in the resulting overall point estimate.
The above construction that requires generating and averaging multiple noisy outputs of arises in the following examples:
-
1.
Input uncertainty quantification in simulation modeling: Here denotes the output performance measure of a stochastic simulation model, where is the distribution of input random variates fed into the simulation logic. For instance, could be the expected workload of a queueing network, and denotes the inter-arrival time distribution. Estimating the performance measure , even with a known input distribution , would require running the simulation model many times (i.e., times) and taking their average. When is observed from exogenous data, we use a plug-in estimate to drive the input variates in the simulation model (Henderson (2003); Song et al. (2014); Barton (2012); Lam (2016)). This amounts to the point estimate (13).
-
2.
Bagging: Bagging predictors are constructed by averaging a large number of base predictors, where each base predictor is obtained by re-training the model on a new resample of the data (Breiman (1996); Bühlmann and Yu (2002)). Here, denotes the target predicted value (at some tested point) of the bagging predictor, and is the data distribution. The quantity denotes the predicted value of a model trained on a resample from .
-
3.
Deep ensemble: Deep ensembles are predictors constructed by averaging several neural networks, each trained from the same data but using a different randomization seed (Lakshminarayanan et al. (2016); Lee et al. (2015)). The seed controls, for instance, the initialization of a stochastic gradient descent. Like bagging, here denotes the target predicted value (at some tested point) where is the data distribution. However, the quantity refers to the output of a trained individual neural network.
Applying the bootstrap to assess the uncertainty of (13) requires a nested sampling that involves two layers: First, we resample the data times to obtain . Then, given each resample , we run our computation procedure times to obtain . The quantities
| (14) |
then serve as the resample estimates whose statistic (e.g., quantiles or standard deviation) can be used to obtain a confidence interval for the target quantity . The computation effort in generating these intervals is the product between the outer number of resamples and the inner number of computation runs, namely . The number needs to be sufficiently large as required by conventional bootstraps. The number , depending on the context, may also need to be large. For instance, the simulation modeling and bagging examples above require a large enough . Furthermore, not only does need to be large, but it could also depend (linearly) on the data size in order to achieve consistency, as shown in the context of simulation modeling (Lam and Qian (2021, 2018c)). In other words, the difficulty with nested sampling when running the bootstrap not only lies in the multiplicative computation effort between and , but also that their choices can depend intricately on the data size which adds to the complication.
Cheap Bootstrap reduces the outer number of resamples to a low number, a strength that we investigate in this section. To build the theoretical framework, we first derive an asymptotic on problems involving noises from both data and computation. Denote and as the variance and third-order absolute central moment of a computation run driven by a given input distribution . We assume the following.
Assumption 2 (Moment consistency of computation runs).
We have and as , where and . Similarly, and .
Assumption 2 can be justified if and are Hadamard differentiable with non-degenerate derivatives like in Assumption 1. Specifically, we have the following:
In stating our asymptotic result below, we consider a slightly more general version of the bootstrap where the computation sizes in the original estimate and the resample estimates are allowed to be different, which gives some extra flexibility to our procedures. That is, we use as defined in (13) where denotes the computation size in constructing the point estimate. Then we resample times and obtain as defined in (14) where denotes the computation size in constructing each resample estimate. Moreover, we denote as the hypothetical original estimate constructed from without any computation noise, and as the hypothetical -th resample estimate without computation noise. We have the following:
Theorem 3 (Joint asymptotic of original and resample estimates under both data and computation noises).
Note that the scaling and in Theorem 3 are introduced only for mathematical convenience. The convergence (15) stipulates that
It implies, in particular, that the standard error of is given by which consists of two parts: captures the variability from the data and from the computation.
Theorem 3 is a generalization of Proposition 1. The random variables ’s and ’s in the limit each signifies a source of noise coming from either data or computation. More specifically, comes from the original data, from each resample, from the computation of the original estimate, and from the computation of each resample. Unlike (5), in (15) the (centered) resample estimate and original estimate are no longer asymptotically independent, because they share the same source of noise . This causes modifications to our Cheap Bootstrap in canceling out the nuisance parameter.
We will describe two approaches to construct Cheap Bootstrap confidence intervals for under the conditions in Theorem 3, both resulting in the form
| (16) |
where , like the in (1), is a standard error estimate of . These two approaches differ by how we pool together the resample estimates in , where the therein denotes the approach. Correspondingly, the critical value is obtained from the -quantile of a distribution pertinent to the pivotal statistic using . Both approaches we propose achieve asymptotic validity with very few resamples.
4.1 Centered at Original Estimate
In the first approach, we use in (16)
| (17) |
That is, acts as the sample variance of the bootstrap estimates, where the center of the squares is set to be . We choose to be
| (18) |
where is the distribution function of
| (19) |
with and being all independent, and is the square-rooted ratio between the computation size used in the original estimate and each resample estimate. When , we set in (19) so that the expression is equivalent to
| (20) |
We call the resulting interval
| (21) |
the Cheap Bootstrap interval “centered at original estimate”.
Note that the distribution function has no closed-form expression or reduction to any common distribution where a table or built-in calculator is available. However, it can be easily simulated, for instance, by running many independent copies of , say for , and computing (via, e.g., a simple grid search)
| (22) |
where denotes the indicator function, to approximate . Note that this Monte Carlo computation only involves standard normal and random variables, not the noisy model evaluation that could be expensive.
We have the following guarantee:
Theorem 4 (Asymptotic validity of Cheap Bootstrap “centered at point estimate”).
Under the same assumptions and setting in Theorem 3, the interval in (21), where and are defined in (17) and (18), is an asymptotically valid -level confidence interval, i.e., it satisfies
as , where denotes the probability with respect to the data and all randomness from the resampling and computation.
Theorem 4 is obtained by looking at the asymptotic distribution of the (approximately) pivotal statistic . However, because of the dependence between the original and resample estimates in (15), the unknown nuisance parameters and are not directly canceled out. To tackle this, we consider a worst-case calculation which leads to some conservativeness in the coverage guarantee, i.e., inequality instead of exact equality in Theorem 4.
4.2 Centered at Resample Mean
We consider our second approach. For , we use in (16)
| (23) |
where is the sample mean of ’s given by . That is, we use the sample variance of ’s as our standard error estimate. Correspondingly, we set
| (24) |
where, like in Section 4.1, is the square-rooted ratio between the computation sizes of the original estimate and each resample estimate. Also, recall is the -quantile of . We call the resulting interval
| (25) |
the Cheap Bootstrap interval “centered at resample mean”.
We have the following guarantee:
Theorem 5 (Asymptotic validity of Cheap Bootstrap “centered at resample mean”).
Under the same assumptions and setting in Theorem 3, for , the interval in (25) where and are defined in (23) and (24), is an asymptotically valid -level confidence interval, i.e., it satisfies
as , where denotes the probability with respect to the data and all randomness from the resampling and computation. Moreover, if the computation sizes for each resample estimate and the original estimate are the same, i.e., , then is asymptotically exact, i.e.,
Compared to in Section 4.1, does not require Monte Carlo computation for and is thus easier to use. Moreover, note that when the computation size used in each resample estimate is at most that used in the original estimate, i.e., , we have , so the critical value in reduces to a standard -quantile, just like the interval (1) for non-nested problems. Furthermore, when these computation sizes are the same, then we have asymptotically exact coverage in Theorem 5. On the other hand, is defined for instead of , and thus its requirement on is slightly more stringent than and (1).
5 Cheap Subsampling
We integrate Cheap Bootstrap into, in broad term, subsampling methods where the bootstrap resample has a smaller size than the original full data size. Subsampling is motivated by the lack of consistency when applying standard bootstraps in non-smooth problems (Politis et al. (1999); Bickel et al. (1997)), but also can be used to address the computational challenge in repeatedly fitting models over large data sets (Kleiner et al. (2012)). The latter arises because standard sampling with replacement on the original data retains around of the observation values, thus for many problems each bootstrap resample estimate requires roughly the same computation order as the original estimate constructed from the raw data.
Here we consider three subsampling variants: -out-of- Bootstrap (Bickel et al. (1997)), and the more recent Bag of Little Bootstraps (Kleiner et al. (2014)) and Subsampled Double Bootstrap (Sengupta et al. (2016)). The validity of these methods relies on generalizations of Assumption 1 (though not always, as explained at the end of this section), in which the distribution of can be approximated by that of , where and/or are some estimators obtained using a small resample data size or number of distinct observed values, and is a suitable scaling parameter. More precisely, suppose we have in probability conditional on the data and possibly independent randomness (the independent randomness is sometimes used to help determine ). Then, to construct a -level confidence interval for , we can simulate the and -quantiles of , say and , and then output
Like in the standard bootstrap, such an approach requires many Monte Carlo replications.
We describe how to use subsampling in conjunction with Cheap Bootstrap to devise bootstrap schemes that are small simultaneously in the number of resamples and the resample data size (or number of distinct observed values in use). Following the ideas in Sections 2 and 3, our Cheap Subsampling unifiedly uses the following framework: Generate and given and any required additional randomness, for . Then the -level confidence interval is given by
| (26) |
where
Compared to (1), the main difference in (26) is the adjusting factor in the standard error.
Below we describe the application of the above framework into three subsampling variants. Like in Section 2, suppose the target parameter is and we have obtained the point estimate .
5.1 Cheap -out-of- Bootstrap
We compute subsample estimates , , where is the empirical distribution constructed from a subsample of size drawn from the raw data via sampling with replacement. Then output the interval
| (27) |
where .
Cast in our framework above, here we take to be always the original estimate , to be a subsample estimate , and the scale parameter to be the subsample size .
5.2 Cheap Bag of Little Bootstraps
We first construct , where is the empirical distribution of a subsample of size , called , drawn from the raw data via sampling without replacement (i.e., is an -subset of ). The subsample , once drawn, is fixed throughout. Given , we generate , , where is the empirical distribution constructed from sampling with replacement from the subsample for times, with being the original full data size (i.e., is a weighted empirical distribution over ). We output the interval in (1), where now
| (28) |
Cast in our framework, here we take to be always , to be the double resample estimate , and the scale parameter to be the original data size . The subsampling used to obtain introduces an additional randomness that is conditioned upon in the conditional weak convergence described before. Note that when is small, the double resample estimate , though constructed with a full size data, uses only a small number of distinct data points which, in problems such as -estimation, involves only a weighted estimation on the small-size subsample (Kleiner et al. (2014)).
5.3 Cheap Subsampled Double Bootstrap
For , we do the following: First, generate a subsample estimate where is the empirical distribution of a subsample of size , called , drawn from the raw data via sampling without replacement (i.e., is an -subset of ). Then, given , we construct where is the empirical distribution of a size- resample constructed by sampling with replacement from . We output the interval in (1), where now
| (29) |
Cheap Subsampled Double Bootstrap is similar to Cheap Bag of Little Bootstraps, but the in our framework is now taken as a subsample estimate that is newly generated from a new subsample for each , and is obtained by resampling with replacement from that particular .
5.4 Theory of Cheap Subsampling
All of Cheap -out-of- Bootstrap, Cheap Bag of Little Bootstraps, and Cheap Subsampled Double Bootstrap achieve asymptotic exactness for any . To state this concretely, we denote , where is the canonical metric.
Theorem 6 (Asymptotic exactness of Cheap Subsampling).
Suppose the assumptions in Proposition 2 hold, and in addition is measurable for every . Then the intervals produced by Cheap -out-of- Bootstrap (i.e., (27)), Cheap Bag of Little Bootstraps (i.e., (1) using (28)), and Cheap Subsampled Double Bootstrap (i.e., (1) using (29)) are all asymptotically exact for as with .
The proof of Theorem 6 uses a similar roadmap as Theorem 1 and the subsampling analogs of Assumption 1, which hold under the additional technical measurability condition on and have been used to justify the original version of these subsampling methods.
We make a couple of remarks. First, the original Bag of Little Bootstraps suggests to use several, or even a growing number of different subsample estimates, instead of a fixed subsample as we have presented earlier. Then from each subsample, an adequate number of resamples are drawn to obtain a quantile that informs an interval limit. These quantile estimates from different subsamples are averaged to obtain the final interval limit. Note that this suggestion requires a multiplicative amount of computation effort, and is motivated from better convergence rates (Kleiner et al. (2014) Theorems 2 and 3). Here, we simply use one subsample as we focus on the case of small Monte Carlo replication budget, but the modification to include multiple subsamples is feasible, evidenced by the validity of Cheap Subsampled Double Bootstrap which essentially uses a different subsample in each bootstrap replication. Second, in addition to allowing a smaller data size in model refitting, the -out-of- Bootstrap, and also the closely related subsampling without replacement or so-called sampling, as well as sample splitting (Politis et al. (1999); Bickel et al. (1997)), are all motivated as remedies to handle non-smooth functions where standard bootstraps could fail. Instead of conditional weak convergence which we utilize in this work, these approaches are shown to provide consistent estimates based on symmetric statistics (Politis and Romano (1994)).
6 Numerical Results
We test the numerical performances of our Cheap Bootstrap and compare it with baseline bootstrap approaches. Specifically, we consider elementary variance and correlation estimation (Section 6.1), regression (Section 6.2), simulation input uncertainty quantification (Section 6.3) and deep ensemble prediction (Section 6.4). Due to space limit, we show other examples in Appendix E. Among these examples, Cheap Subsampling is also investigated in Section 6.2 and nested sampling issues arise in Sections 6.3 and 6.4.
6.1 Elementary Examples
We consider four setups. In the first two setups, we estimate the variance of a distribution using the sample variance. We consider a folded standard normal (i.e., ) and double exponential with rate 1 (i.e., where or with equal probability and is independent of ) as the distribution. In the last two setups, we estimate the correlation using the sample correlation. We consider bivariate normal with mean zero, unit variance and correlation , and bivariate lognormal (i.e., where is the bivariate normal just described). We use a sample size in all cases. We set the confidence level . The ground truths of all the setups are known, namely , , and respectively (these examples are also used in, e.g., Schenker (1985); DiCiccio et al. (1992); Lee and Young (1995)).
We run Cheap Bootstrap using a small number of resamples , and compare with the Basic Bootstrap, Percentile Bootstrap and Standard Error Bootstrap. For each setting, we repeat the experiments times and report the empirical coverage and interval width mean and standard deviation. Table 3 shows the performances for variance and correlation estimation that are similar to Table 1 in Section 2.2. Cheap Bootstrap gives rise to accurate coverage () in all considered cases, including when is as low as . On the other hand, all baseline methods fail to generate two-sided intervals when , and encounter significant under-coverage when to (e.g., as low as for and when ). When , these baseline methods start to catch up, with Standard Error Bootstrap rising to a coverage level close to . These observations coincide with our theory of Cheap Bootstrap presented in Sections 2 and 3, and also that the baseline methods are all designed to work under a large .
Regarding the interval width, its mean and standard deviation for Cheap Bootstrap are initially large at , signifying a price on statistical efficiency when the computation budget is very small. These numbers drop quickly when increases from to and continue to drop at a decreasing rate as increases further. In contrast, all baseline methods have lower width means and standard deviations than our Cheap Bootstrap, with an increasing trend for the mean as increases while the standard deviation remains roughly constant for each method. When , the Cheap Bootstrap interval has generally comparable width mean and standard deviation with the baselines, though still larger. Note that while the baseline methods generate shorter intervals, they have significant under-coverage in the considered range of .
| Variance of | Variance of | Correlation of | Correlation of | ||||||
| Folded normal | Double exponential | Bivariate normal | Bivariate lognormal | ||||||
| Coverage | Width | Coverage | Width | Coverage | Width | Coverage | Width | ||
| (margin | mean | (margin | mean | (margin | mean | (margin | mean | ||
| of error) | (st. dev.) | of error) | (st. dev.) | of error) | (st. dev.) | of error) | (st. dev.) | ||
| Cheap | 1 | 0.95 (0.01) | 0.38 (0.29) | 0.94 (0.01) | 2.84 (2.27) | 0.93 (0.02) | 0.47 (0.37) | 0.95 (0.01) | 1.03 (0.83) |
| Basic | 1 | NA | NA | NA | NA | NA | NA | NA | NA |
| Per. | 1 | NA | NA | NA | NA | NA | NA | NA | NA |
| S.E. | 1 | NA | NA | NA | NA | NA | NA | NA | NA |
| Cheap | 2 | 0.95 (0.01) | 0.15 (0.08) | 0.94 (0.01) | 1.10 (0.60) | 0.95 (0.01) | 0.18 (0.10) | 0.94 (0.01) | 0.38 (0.25) |
| Basic | 2 | 0.30 (0.03) | 0.02 (0.02) | 0.31 (0.03) | 0.16 (0.13) | 0.32 (0.03) | 0.03 (0.02) | 0.28 (0.03) | 0.06 (0.05) |
| Per. | 2 | 0.33 (0.03) | 0.02 (0.02) | 0.32 (0.03) | 0.16 (0.13) | 0.32 (0.03) | 0.03 (0.02) | 0.32 (0.03) | 0.06 (0.05) |
| S.E. | 2 | 0.68 (0.03) | 0.06 (0.05) | 0.69 (0.03) | 0.45 (0.35) | 0.69 (0.03) | 0.07 (0.06) | 0.65 (0.03) | 0.15 (0.14) |
| Cheap | 3 | 0.95 (0.01) | 0.11 (0.05) | 0.94 (0.02) | 0.81 (0.37) | 0.95 (0.01) | 0.14 (0.06) | 0.94 (0.01) | 0.29 (0.15) |
| Basic | 3 | 0.50 (0.03) | 0.03 (0.02) | 0.48 (0.03) | 0.23 (0.13) | 0.48 (0.03) | 0.04 (0.02) | 0.46 (0.03) | 0.08 (0.05) |
| Per. | 3 | 0.50 (0.03) | 0.03 (0.02) | 0.48 (0.03) | 0.23 (0.13) | 0.52 (0.03) | 0.04 (0.02) | 0.46 (0.03) | 0.08 (0.05) |
| S.E. | 3 | 0.81 (0.02) | 0.07 (0.04) | 0.78 (0.03) | 0.48 (0.27) | 0.81 (0.02) | 0.08 (0.04) | 0.80 (0.02) | 0.17 (0.11) |
| Cheap | 4 | 0.96 (0.01) | 0.10 (0.04) | 0.96 (0.01) | 0.73 (0.28) | 0.94 (0.01) | 0.12 (0.05) | 0.94 (0.02) | 0.26 (0.12) |
| Basic | 4 | 0.62 (0.03) | 0.04 (0.02) | 0.62 (0.03) | 0.29 (0.13) | 0.61 (0.03) | 0.05 (0.02) | 0.54 (0.03) | 0.10 (0.05) |
| Per. | 4 | 0.62 (0.03) | 0.04 (0.02) | 0.60 (0.03) | 0.29 (0.13) | 0.61 (0.03) | 0.05 (0.02) | 0.59 (0.03) | 0.10 (0.05) |
| S.E. | 4 | 0.86 (0.02) | 0.07 (0.03) | 0.86 (0.02) | 0.50 (0.22) | 0.86 (0.02) | 0.09 (0.04) | 0.81 (0.02) | 0.17 (0.09) |
| Cheap | 5 | 0.95 (0.01) | 0.10 (0.03) | 0.95 (0.01) | 0.68 (0.24) | 0.94 (0.01) | 0.12 (0.04) | 0.91 (0.02) | 0.25 (0.12) |
| Basic | 5 | 0.67 (0.03) | 0.05 (0.02) | 0.67 (0.03) | 0.32 (0.13) | 0.66 (0.03) | 0.06 (0.02) | 0.58 (0.03) | 0.12 (0.06) |
| Per. | 5 | 0.66 (0.03) | 0.05 (0.02) | 0.65 (0.03) | 0.32 (0.13) | 0.65 (0.03) | 0.06 (0.02) | 0.61 (0.03) | 0.12 (0.06) |
| S.E. | 5 | 0.87 (0.02) | 0.07 (0.03) | 0.86 (0.02) | 0.51 (0.20) | 0.86 (0.02) | 0.09 (0.03) | 0.83 (0.02) | 0.19 (0.10) |
| Cheap | 10 | 0.93 (0.02) | 0.08 (0.02) | 0.94 (0.01) | 0.62 (0.17) | 0.94 (0.01) | 0.10 (0.02) | 0.91 (0.02) | 0.21 (0.09) |
| Basic | 10 | 0.79 (0.03) | 0.06 (0.02) | 0.80 (0.02) | 0.43 (0.13) | 0.83 (0.02) | 0.07 (0.02) | 0.73 (0.03) | 0.15 (0.06) |
| Per. | 10 | 0.79 (0.03) | 0.06 (0.02) | 0.80 (0.02) | 0.43 (0.13) | 0.80 (0.02) | 0.07 (0.02) | 0.78 (0.03) | 0.15 (0.06) |
| S.E. | 10 | 0.90 (0.02) | 0.07 (0.02) | 0.91 (0.02) | 0.54 (0.15) | 0.92 (0.02) | 0.09 (0.02) | 0.86 (0.02) | 0.19 (0.08) |
6.2 Regression Problems
We apply our Cheap Bootstrap and compare with standard approaches on a linear regression. The example is adopted from Sengupta et al. (2016) §4 and Kleiner et al. (2014) §4. We fit a model , where we set dimension and use data of size to fit the model and estimate the coefficients ’s. The ground truth is set as for , , and for .
In addition to full-size Cheap Bootstrap, we run the three variants of Cheap Subsampling, namely Cheap -out-of- Bootstrap, Cheap Bag of Little Bootstraps (BLB), and Cheap Subsampled Double Bootstrap (SDB). Moreover, we compare each cheap bootstrap method with its standard quantile-based counterpart (i.e., the basic bootstrap described in Section 2.1 and the subsample counterparts at the beginning of Section 5, with one fixed subsample in the Bag of Little Bootstrap case) to compute confidence intervals for the first coefficient . For the subsampling methods, we use subsample size , which is also used in Sengupta et al. (2016) and Kleiner et al. (2014). We use in total resamples for each method. We repeat the experiments times, each time we regenerate a new synthetic data set. For the number of resamples starting from 1 to , we compute the empirical coverage probability and the mean and standard deviation of the confidence interval width for the first coefficient.


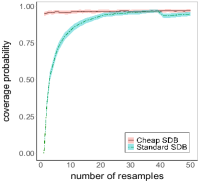


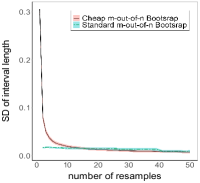


Figure 1 shows the empirical coverage probability against the number of resamples from the experimental repetitions. In the first graph, we see that Standard Bootstrap falls short of the nominal coverage, severely when is small and gradually improves as increases. For example, the coverage probability at is and at is . On the other hand, Cheap Bootstrap gives close to the nominal coverage starting from the first replication (), and the coverage stays between and throughout. The comparison is similar for subsampling methods, where with small Standard -out-of-, Bag of Little Bootstrap and Subsampled Double Bootstrap all under-cover and gradually approach the nominal level as increases. For a more specific comparison, at for instance, Standard -out-of-, Bags of Little Bootstrap and Subsampled Double Bootstrap have under-coverages of , and respectively, while the Cheap counterparts attain , and . We note that the “sudden drop” in the coverage probability for all Standard bootstrap methods at the -st resample in Figure 1 (as well as all the following figures) is due to the discontinuity in the empirical quantile, which is calculated by inverting the empirical distribution and at this number of resamples the inverse switches from outputting the largest or smallest resample estimate to the second largest or smallest.
Figure 2 shows the mean interval width against the number of resamples (note that the confidence intervals for the mean width estimates are very narrow, meaning that the estimates are accurate, which makes the shaded regions in the figure difficult to visualize). These plots show that the mean interval widths of Cheap bootstrap methods are initially large when only one replication is used, then decrease sharply when the number of resamples increases and then continue to decrease at a slower rate. Figure 3 shows the standard deviation of the interval width against the number of resamples, which follow a similar trend as the mean in Figure 2. More specifically, the interval width mean and standard deviation of Cheap Bootstrap are and at , drop sharply to and at , further to and at , and and at , with negligible reduction afterwards. These trends match our theory regarding the interval width pattern in Section 3.3. On the other hand, the interval width means of Standard methods are initially small and increase with the number of resamples, while the standard deviations are roughly constant. Note that at it is not possible to generate confidence intervals using Standard bootstrap methods, and the interval width mean and standard deviation are undefined. Moreover, even though the interval widths in Standard bootstrap methods appear lower generally, these intervals can substantially under-cover the truth when is small.
We present another example on logistic regression in Appendix E.1 which shows similar experimental observations discussed above.
6.3 Input Uncertainty Quantification in Simulation Modeling
We present an example on the input uncertainty quantification problem in simulation modeling discussed in Section 4. Our target quantity of interest is the expected average waiting time of the first 10 customers in a single-server queueing system, where the interarrival times and service time are i.i.d. with ground truth distributions being exponential with rates and respectively. The queue starts empty and the first customer immediately arrives. This system is amenable to discrete-event simulation and has been used commonly in existing works in input uncertainty quantification (e.g., Barton et al. (2014); Song and Nelson (2015); Zouaoui and Wilson (2004)). Suppose we do not know the interarrival time distribution but instead have external data of size . To compute a point estimate of the expected waiting time, we use the empirical distribution constructed from the 100 observations, denoted , as an approximation to the interarrrival time distribution that is used to drive simulation runs. We conduct unbiased simulation runs, each giving output , and then average the outputs of these runs to get .
To obtain a confidence interval, we use Cheap Bootstrap centered at original estimate and centered at resample mean presented in Sections 4.1 and 4.2 respectively. More precisely, the first approach constructs the interval using (16) with (17) and (18), while the second approach constructs the interval using (16) with (23) and (24). In both approaches, we set the simulation size for each resample estimate to equal that for the original estimate, i.e., . To construct , we need to approximate the critical value using (22), where we set and discretize over a grid . Then we increase from and iteratively check whether
| (30) |
is greater than ; if not, we increase by a step size , until we reach a such that (30) passes . We detail the computed values of in Appendix E.2.
Using the above, we construct and at ranging from to . For each , we repeat our experiments times to record the empirical coverage and interval width mean and standard deviation. To calculate the empirical coverage, we run 1 million simulation runs under the true interarrival and service time distributions to obtain an accurate estimate of the ground truth value. Table 4 shows the performances of and , and also the comparisons with the Basic and Percentile Bootstraps that treat in (14) as the resample estimates. We see that the coverage of is very close to the nominal confidence level at all considered , ranging in . The coverage of is also close, ranging in . The interval width performances for both and behave similarly as previous examples, with initially large width at or , falling sharply when increases by 1 or 2, and flattening out afterwards. The Basic and Percentile Bootstraps have coverages substantially deviated from the nominal , though they improve as increases. The inferior coverages of these conventional methods can be caused by both the inadequate and also the ignorance of the simulation noise in their implementation.
| Cheap bootstrap centered | Cheap bootstrap centered | Basic bootstrap | Percentile bootstrap | |||||
| at original estimate | at resample mean | |||||||
| Coverage | Width | Coverage | Width | Coverage | Width | Coverage | Width | |
| (margin | mean | (margin | mean | (margin | mean | (margin | mean | |
| of error) | (st. dev.) | of error) | (st. dev.) | of error) | (st. dev.) | of error) | (st. dev.) | |
| 1 | 0.96 (0.01) | 6.73 (5.41) | NA | NA | NA | NA | NA | NA |
| 2 | 0.95 (0.01) | 2.55 (1.50) | 0.94 (0.02) | 5.84 (4.86) | 0.35 (0.03) | 0.33 (0.26) | 0.27 (0.03) | 0.33 (0.26) |
| 3 | 0.95 (0.01) | 1.97 (0.99) | 0.94 (0.01) | 2.26 (1.30) | 0.52 (0.03) | 0.50 (0.29) | 0.41 (0.03) | 0.50 (0.29) |
| 4 | 0.95 (0.01) | 1.74 (0.79) | 0.94 (0.01) | 1.73 (0.84) | 0.64 (0.03) | 0.59 (0.29) | 0.48 (0.03) | 0.59 (0.29) |
| 5 | 0.95 (0.01) | 1.64 (0.69) | 0.93 (0.02) | 1.54 (0.68) | 0.71 (0.03) | 0.66 (0.29) | 0.54 (0.03) | 0.66 (0.29) |
| 6 | 0.95 (0.01) | 1.58 (0.63) | 0.93 (0.02) | 1.45 (0.59) | 0.75 (0.03) | 0.72 (0.29) | 0.58 (0.03) | 0.72 (0.29) |
| 7 | 0.95 (0.01) | 1.54 (0.58) | 0.93 (0.02) | 1.40 (0.53) | 0.77 (0.03) | 0.76 (0.29) | 0.61 (0.03) | 0.76 (0.29) |
| 8 | 0.95 (0.01) | 1.50 (0.55) | 0.93 (0.02) | 1.35 (0.49) | 0.79 (0.03) | 0.80 (0.29) | 0.64 (0.03) | 0.80 (0.29) |
| 9 | 0.95 (0.01) | 1.48 (0.53) | 0.93 (0.02) | 1.33 (0.47) | 0.81 (0.02) | 0.82 (0.29) | 0.65 (0.03) | 0.82 (0.29) |
| 10 | 0.95 (0.01) | 1.46 (0.51) | 0.93 (0.02) | 1.31 (0.44) | 0.83 (0.02) | 0.85 (0.29) | 0.67 (0.03) | 0.85 (0.29) |
Compared with existing works on input uncertainty quantification, we highlight that the computational load in Cheap Bootstrap is significantly lower. According to Table 4, can be taken as, for instance, 3 or 4 in to obtain a reasonable confidence interval, so that the total computation cost is which is 200 or 250 when we use (including the cost to compute the original point estimate). In contrast, bootstrap approaches proposed in the literature suggest to use at least in numerical examples (e.g., Cheng and Holland (2004); Song and Nelson (2015)) or linearly dependent on the parameter dimension (e.g., times the dimension when using the so-called metamodel-assisted bootstrap in the parametric case; Xie et al. (2014)).
6.4 Deep Ensemble Prediction
We consider deep ensemble prediction described in Section 4. We build a prediction model from i.i.d. supervised data of size . Here the feature vector is 16-dimensional and . Suppose each dimension of is generated from the uniform distribution on , and the ground-truth model is . We build a deep ensemble by training base neural networks each using an independent random initialization, and average these networks to obtain a predictor. More specifically, each base neural network has two fully connected layers with hidden neurons, using rectified linear unit as activation. It is trained using the squared loss with -regularization on the neuron weights, and Adam for gradient descent. All the weights in each neural network are initialized as independent variables.
Like in Section 6.3, we use Cheap Bootstrap centered at original estimate and centered at resample mean to construct confidence intervals for the prediction output. Here, we consider a test point with value in all dimensions. We set in both approaches, and use Table 5 in Appendix E.2 to calibrate the critical value in . We repeat the experiments times to take down statistics on the generated confidence intervals. Figure 4 depicts the box plots of the confidence interval widths using to , for and respectively. We see that the interval widths are relatively large for (in the case of ) and for (in the case of which is only well-defined starting from ), but decrease fast when increases. When (in the case of ) and (in the case of ), the interval widths appear to more or less stabilize.


Next, we also train deep ensemble predictors for a real data set on Boston housing, available at https://www.kaggle.com/c/boston-housing. The data set has size and feature dimension . Like in our synthetic data, we use , and the same configurations of base neural networks and training methods. We split the data by to a training set and to a testing set, where only the training set is used to construct the predictor and also run our Cheap Bootstrap, with again . Then we create the Cheap Bootstrap confidence intervals for the prediction values of the testing set. Figure 5 shows the box plots of the widths of these intervals, namely and , for ranging from to . We see that the widths fall sharply when is small ( in and in ) and stabilize quickly afterwards.


In Appendix E.3, we present an additional example on constructing confidence bounds for the optimality gaps of data-driven stochastic optimization problems. This problem, which possesses a nested sampling structure, is of interest to stochastic programming. There we would illustrate the performances of Cheap Bootstrap in constructing one-sided confidence bounds.
7 Discussion
Motivated by the computational demand in large-scale problems where repeated model refitting can be costly, in this paper we propose a Cheap Bootstrap method that can use very few resamples for bootstrap inference. A key element of our method is that it attains asymptotically exact coverage for any number of resamples, including as low as one. This is in contrast to conventional bootstrap approaches that require running many Monte Carlo replications. Our theory on the Cheap Bootstrap also differs from these approaches by exploiting the asymptotic independence between the original estimate and resample estimates, instead of a direct approximation of the sampling distribution via the reasample counterpart, the latter typically executed by running many Monte Carlo runs in order to obtain accurate summary statistics from the resamples.
Besides the basic asymptotic coverage guarantee, we have studied several aspects of the Cheap Bootstrap. First is its higher-order coverage errors which match the conventional basic and percentile bootstraps. This error analysis is based on an Edgeworth expansion on a -limit which, to our knowledge, has not been studied in the literature that has focused on normal limits. Second is the half-width behavior, where we show that the half widths of Cheap Bootstrap intervals are naturally wider for small number of resamples, and match the conventional approaches when resample size increases. Moreover, the decrease in the half width is sharp when the resample number is very small and flattens quickly, thus leading to a reasonable half-width performance with only few resamples. In addition, we have also investigated several generalizations of the Cheap Bootstrap, including its applications to nested sampling problems, subsampling procedures, and multivariate extensions. Our numerical results validate the performances of Cheap Bootstrap, especially its ability to conduct valid inference with an extremely small number of resamples.
This work is intended to lay the foundation of the proposed Cheap Bootstrap method. In principle, this method can be applied to many other problems than those shown in our numerical section. Essentially, for any problem where bootstrap interval is used and justified via the standard condition - conditional asymptotic normality of the resamples, one can adopt the Cheap Bootstrap in lieu of conventional bootstraps. Besides applying and testing the performances of Cheap Bootstrap across these other problems, we believe the following are also worth further investigation:
Comparison with the infinitesimal jackknife and the jackknife: While we have focused our comparisons primarily within the bootstrap family, the Cheap Bootstrap bears advantages when compared to non-bootstrap alternatives including the infinitesimal jackknife and the jackknife. These advantages inherit from the bootstrap approach in general, but strengthened further with the light resampling effort. The infinitesimal jackknife, or the delta method, uses a linear approximation to evaluate the standard error. This approach relies on influence function calculation that could be tedious analytically, and also computationally due to, for instance, the inversion of big matrices in -estimation. The jackkknife, which relies on leave-one-out estimates, generally requires a number of model evaluation that is the same as the sample size. The Cheap Bootstrap thus provides potential significant computation savings compared to both methods. Note, however, that it is possible to combine the jackknife with batching to reduce computation load (see the next discussion point).
In problems facing nested sampling such as those in Section 4, it is also possible to use non-bootstrap techniques such as the infinitesimal jackknife. In fact, the latter is particularly handy to derive for problems involving double resampling such as bagging predictors (e.g., Wager et al. (2014)). Nonetheless, it is open to our knowledge whether these alternatives can generally resolve the expensive nested sampling requirement faced by conventional bootstraps, especially in problems lacking unbiased estimators for the influence function. In these cases, the need to control the entangled noises coming from both data and computation could necessitate a large computation size, despite the apparent avoidance of nested sampling.
Comparison with batching: A technique prominently used in the simulation literature, but perhaps less common in statistics, is known as batch means or more generally standardized time series (Glynn and Iglehart (1990); Schmeiser (1982); Schruben (1983); Glynn and Lam (2018)). This technique conducts inference by grouping data into batches and aggregating them via -statistics. The batches can be disjoint or overlapping (Meketon and Schmeiser (1984); Song and Schmeiser (1995)), similar to the blocks in subsampling (Politis and Romano (1994)). While batch means uses -statistics like our Cheap Bootstrap, it utilizes solely the original sample instead of resample, and is motivated to handle serially dependent observations in simulation outputs such as from Markov chain Monte Carlo (Geyer (1992); Flegal et al. (2010); Jones et al. (2006)).
Batch means in principle can be used to construct confidence intervals with few model evaluations, by using a small number of batches or blocks. However, a potential downside of this approach is that in the disjoint-batches case, dividing a limited sample into batches will thin out the sample size per batch and deteriorate the accuracy of asymptotic approximation. In other words, there is a constrained tradeoff between the number of batches and sample size per batch that limits its accuracy. The Cheap Bootstrap, on the other hand, bypasses this constraint by allowing the use of any number of resamples. In fact, since the observations in different resamples overlap, the Cheap Bootstrap appears closer to overlapping batching. To this end, overlapping batching contains multiple tuning parameters to specify how the batches overlap, which could also affect the asymptotic distributions. In this regard, the Cheap Bootstrap appears easier to use as the only parameter needed is the resample budget, which is decided by the amount of computation resource.
One approach to obtain more in-depth theoretical comparisons between the Cheap Bootstrap and batching is to analyze the coefficients in the respective higher-order coverage expansions. This comprises an immediate future direction.
High-dimensional problems: As the main advantage of the Cheap Bootstrap relative to other approaches is its light computation, it would be revealing to analyze the error of the Cheap Bootstrap in high-dimensional problems where computation saving is of utmost importance. Regarding this, it is possible to obtain bounds for the coverage error of Cheap Bootstrap with explicit dependence on problem dimension, by following our analysis roadmap in Section 3.2 but integrating with high-dimensional Berry-Esseen-type bounds for normal limits (Chernozhukov et al. (2017); Fang and Koike (2021)).
Higher-order coverage accuracy: Although our investigation is orthogonal to the bootstrap literature on higher-order coverage error refinements, we speculate that our Cheap Bootstrap can be sharpened to exhibit second-order accurate intervals, by replacing the -quantile with a bootstrap calibrated quantile. This approach is similar to the studentized bootstrap, but uses few outer resamples in a potential iterated bootstrap procedure. In other words, our computation effort could be larger than elementary bootstraps, as we need to run two layers of resampling, but less than a double bootstrap, as one of the layers consists of only few samples. As a related application, we may apply the Cheap Bootstrap to assess the error of the bootstrap itself, which is done conventionally via bootstrapping the bootstrap or alternately the jackknife-after-bootstrap (Efron (1992)).
Serial dependence: A common bootstrap approach to handle serial dependence is to use block sampling (e.g., Davison and Hinkley (1997) §8). The computation advantage of the Cheap Bootstrap likely continues to hold when using blocks. More specifically, instead of regenerating many series each concatenated from resampled blocks, the Cheap Bootstrap only regenerates few such series and aggregates them via a -approximation. On the other hand, as mentioned above, batch means or subsampling also comprises viable approaches to handle serially dependent data, and the effectiveness of the Cheap Bootstrap compared with these approaches will need further investigation.
Acknowledgments
I gratefully acknowledge support from the National Science Foundation under grants CAREER CMMI-1834710 and IIS-1849280.
References
- Alaa and Van Der Schaar (2020) Alaa, A. and Van Der Schaar, M. (2020) Discriminative jackknife: Quantifying uncertainty in deep learning via higher-order influence functions. In International Conference on Machine Learning, 165–174. PMLR.
- Barton (2012) Barton, R. R. (2012) Tutorial: Input uncertainty in output analysis. In Proceedings of the 2012 Winter Simulation Conference (WSC), 1–12. IEEE.
- Barton et al. (2014) Barton, R. R., Nelson, B. L. and Xie, W. (2014) Quantifying input uncertainty via simulation confidence intervals. INFORMS journal on computing, 26, 74–87.
- Beran (1987) Beran, R. (1987) Prepivoting to reduce level error of confidence sets. Biometrika, 74, 457–468.
- Bickel et al. (1997) Bickel, P. J., Götze, F. and van Zwet, W. R. (1997) Resampling fewer than observations: Gains, losses, and remedies for losses. Statistica Sinica, 7, 1–31.
- Birge and Louveaux (2011) Birge, J. R. and Louveaux, F. (2011) Introduction to stochastic programming. Springer Science & Business Media.
- Booth and Do (1993) Booth, J. G. and Do, K.-A. (1993) Simple and efficient methods for constructing bootstrap confidence intervals. Computational Statistics, 8, 333–333.
- Booth and Hall (1994) Booth, J. G. and Hall, P. (1994) Monte Carlo approximation and the iterated bootstrap. Biometrika, 81, 331–340.
- Breiman (1996) Breiman, L. (1996) Bagging predictors. Machine learning, 24, 123–140.
- Bühlmann and Yu (2002) Bühlmann, P. and Yu, B. (2002) Analyzing bagging. The annals of Statistics, 30, 927–961.
- Cheng and Holland (2004) Cheng, R. C. and Holland, W. (2004) Calculation of confidence intervals for simulation output. ACM Transactions on Modeling and Computer Simulation (TOMACS), 14, 344–362.
- Chernozhukov et al. (2017) Chernozhukov, V., Chetverikov, D. and Kato, K. (2017) Central limit theorems and bootstrap in high dimensions. The Annals of Probability, 45, 2309–2352.
- Davison and Hinkley (1997) Davison, A. C. and Hinkley, D. V. (1997) Bootstrap Methods and Their Application. No. 1. Cambridge University Press.
- DiCiccio et al. (1996) DiCiccio, T. J., Efron, B. et al. (1996) Bootstrap confidence intervals. Statistical Science, 11, 189–228.
- DiCiccio et al. (1992) DiCiccio, T. J., Martin, M. A. and Young, G. A. (1992) Analytical approximations for iterated bootstrap confidence intervals. Statistics and Computing, 2, 161–171.
- Efron (1981) Efron, B. (1981) Nonparametric estimates of standard error: The jackknife, the bootstrap and other methods. Biometrika, 68, 589–599.
- Efron (1982) — (1982) The Jackknife, the Bootstrap and Other Resampling Plans. SIAM.
- Efron (1987) — (1987) Better bootstrap confidence intervals. Journal of the American statistical Association, 82, 171–185.
- Efron (1992) — (1992) Jackknife-after-bootstrap standard errors and influence functions. Journal of the Royal Statistical Society: Series B (Methodological), 54, 83–111.
- Efron and Tibshirani (1994) Efron, B. and Tibshirani, R. J. (1994) An Introduction to the Bootstrap. CRC Press.
- Fang and Koike (2021) Fang, X. and Koike, Y. (2021) High-dimensional central limit theorems by stein’s method. The Annals of Applied Probability, 31, 1660–1686.
- Flegal et al. (2010) Flegal, J. M., Jones, G. L. et al. (2010) Batch means and spectral variance estimators in Markov chain Monte Carlo. The Annals of Statistics, 38, 1034–1070.
- Geyer (1992) Geyer, C. J. (1992) Practical Markov chain Monte Carlo. Statistical Science, 7, 473–483.
- Giordano et al. (2019) Giordano, R., Stephenson, W., Liu, R., Jordan, M. and Broderick, T. (2019) A swiss army infinitesimal jackknife. In The 22nd International Conference on Artificial Intelligence and Statistics, 1139–1147. PMLR.
- Glasserman (2004) Glasserman, P. (2004) Monte Carlo methods in financial engineering, vol. 53. Springer.
- Glynn and Iglehart (1990) Glynn, P. W. and Iglehart, D. L. (1990) Simulation output analysis using standardized time series. Mathematics of Operations Research, 15, 1–16.
- Glynn and Lam (2018) Glynn, P. W. and Lam, H. (2018) Constructing simulation output intervals under input uncertainty via data sectioning. In 2018 Winter Simulation Conference (WSC), 1551–1562. IEEE.
- Hall (1986a) Hall, P. (1986a) On the bootstrap and confidence intervals. Annals of Statistics, 14, 1431–1452.
- Hall (1986b) — (1986b) On the number of bootstrap simulations required to construct a confidence interval. The Annals of Statistics, 1453–1462.
- Hall (2013) — (2013) The Bootstrap and Edgeworth Expansion. Springer Science & Business Media.
- Hall and Martin (1988) Hall, P. and Martin, M. A. (1988) On bootstrap resampling and iteration. Biometrika, 75, 661–671.
- He and Lam (2021) He, S. and Lam, H. (2021) Higher-order coverage errors of batching methods via edgeworth expansions on -statistics. arXiv preprint arXiv:2111.06859.
- Henderson (2003) Henderson, S. G. (2003) Input modeling: Input model uncertainty: Why do we care and what should we do about it? In Proceedings of the 2003 Winter Simulation Conference (eds. S. Chick, P. J. Sánchez, D. Ferrin and D. J. Morrice), 90–100. Piscataway, New Jersey: IEEE.
- Jones et al. (2006) Jones, G. L., Haran, M., Caffo, B. S. and Neath, R. (2006) Fixed-width output analysis for Markov chain Monte Carlo. Journal of the American Statistical Association, 101, 1537–1547.
- Kleiner et al. (2012) Kleiner, A., Talwalkar, A., Sarkar, P. and Jordan, M. I. (2012) The big data bootstrap. In Proceedings of the 29th International Coference on International Conference on Machine Learning, ICML’12, 1787–1794. Madison, WI, USA: Omnipress.
- Kleiner et al. (2014) — (2014) A scalable bootstrap for massive data. Journal of the Royal Statistical Society: Series B: Statistical Methodology, 76, 795–816.
- Kosorok (2007) Kosorok, M. R. (2007) Introduction to Empirical Processes and Semiparametric Inference. Springer Science & Business Media.
- Lakshminarayanan et al. (2016) Lakshminarayanan, B., Pritzel, A. and Blundell, C. (2016) Simple and scalable predictive uncertainty estimation using deep ensembles. arXiv preprint arXiv:1612.01474.
- Lam (2016) Lam, H. (2016) Advanced tutorial: Input uncertainty and robust analysis in stochastic simulation. In Winter Simulation Conference (WSC), 2016, 178–192. IEEE.
- Lam and Qian (2018a) Lam, H. and Qian, H. (2018a) Assessing solution quality in stochastic optimization via bootstrap aggregating. In 2018 Winter Simulation Conference (WSC), 2061–2071. IEEE.
- Lam and Qian (2018b) — (2018b) Bounding optimality gap in stochastic optimization via bagging: Statistical efficiency and stability. arXiv preprint arXiv:1810.02905.
- Lam and Qian (2018c) — (2018c) Subsampling variance for input uncertainty quantification. In 2018 Winter Simulation Conference (WSC), 1611–1622. IEEE.
- Lam and Qian (2021) — (2021) Subsampling to enhance efficiency in input uncertainty quantification. Operations Research.
- Law et al. (1991) Law, A. M., Kelton, W. D. and Kelton, W. D. (1991) Simulation modeling and analysis, vol. 2. McGraw-Hill New York.
- Lee et al. (2015) Lee, S., Purushwalkam, S., Cogswell, M., Crandall, D. and Batra, D. (2015) Why m heads are better than one: Training a diverse ensemble of deep networks. arXiv preprint arXiv:1511.06314.
- Lee and Young (1995) Lee, S. M. and Young, G. A. (1995) Asymptotic iterated bootstrap confidence intervals. The Annals of Statistics, 23, 1301–1330.
- Lu et al. (2020) Lu, Z., Ie, E. and Sha, F. (2020) Uncertainty estimation with infinitesimal jackknife, its distribution and mean-field approximation. arXiv preprint arXiv:2006.07584.
- Mak et al. (1999) Mak, W.-K., Morton, D. P. and Wood, R. K. (1999) Monte carlo bounding techniques for determining solution quality in stochastic programs. Operations research letters, 24, 47–56.
- Meketon and Schmeiser (1984) Meketon, M. S. and Schmeiser, B. (1984) Overlapping batch means: Something for nothing? In Proceedings of the Winter simulation Conference, 227–230.
- Mentch and Hooker (2016) Mentch, L. and Hooker, G. (2016) Quantifying uncertainty in random forests via confidence intervals and hypothesis tests. The Journal of Machine Learning Research, 17, 841–881.
- Nelson (2013) Nelson, B. (2013) Foundations and Methods of Stochastic Simulation: A First Course. Springer Science & Business Media.
- Politis and Romano (1994) Politis, D. N. and Romano, J. P. (1994) Large sample confidence regions based on subsamples under minimal assumptions. The Annals of Statistics, 22, 2031–2050.
- Politis et al. (1999) Politis, D. N., Romano, J. P. and Wolf, M. (1999) Subsampling. Springer Science & Business Media.
- Schenker (1985) Schenker, N. (1985) Qualms about bootstrap confidence intervals. Journal of the American Statistical Association, 80, 360–361.
- Schmeiser (1982) Schmeiser, B. (1982) Batch size effects in the analysis of simulation output. Operations Research, 30, 556–568.
- Schruben (1983) Schruben, L. (1983) Confidence interval estimation using standardized time series. Operations Research, 31, 1090–1108.
- Schulam and Saria (2019) Schulam, P. and Saria, S. (2019) Can you trust this prediction? auditing pointwise reliability after learning. In The 22nd International Conference on Artificial Intelligence and Statistics, 1022–1031. PMLR.
- Sengupta et al. (2016) Sengupta, S., Volgushev, S. and Shao, X. (2016) A subsampled double bootstrap for massive data. Journal of the American Statistical Association, 111, 1222–1232.
- Shao and Tu (2012) Shao, J. and Tu, D. (2012) The jackknife and bootstrap. Springer Science & Business Media.
- Shapiro et al. (2021) Shapiro, A., Dentcheva, D. and Ruszczynski, A. (2021) Lectures on stochastic programming: modeling and theory. SIAM.
- Song and Nelson (2015) Song, E. and Nelson, B. L. (2015) Quickly assessing contributions to input uncertainty. IIE Transactions, 47, 893–909.
- Song et al. (2014) Song, E., Nelson, B. L. and Pegden, C. D. (2014) Advanced tutorial: Input uncertainty quantification. In Proceedings of the 2014 Winter Simulation Conference (eds. A. Tolk, S. Diallo, I. Ryzhov, L. Yilmaz, S. Buckley and J. Miller), 162–176. Piscataway, New Jersey: IEEE.
- Song and Schmeiser (1995) Song, W. T. and Schmeiser, B. W. (1995) Optimal mean-squared-error batch sizes. Management Science, 41, 110–123.
- Van der Vaart (2000) Van der Vaart, A. W. (2000) Asymptotic Statistics, vol. 3. Cambridge University Press.
- Van der Vaart and Wellner (2013) Van der Vaart, A. W. and Wellner, J. A. (2013) Weak Convergence and Empirical Processes: With Applications to Statistics. Springer Science & Business Media.
- Wager et al. (2014) Wager, S., Hastie, T. and Efron, B. (2014) Confidence intervals for random forests: The jackknife and the infinitesimal jackknife. The Journal of Machine Learning Research, 15, 1625–1651.
- Wall et al. (2001) Wall, M. M., Boen, J. and Tweedie, R. (2001) An effective confidence interval for the mean with samples of size one and two. The American Statistician, 55, 102–105.
- Xie et al. (2014) Xie, W., Nelson, B. L. and Barton, R. R. (2014) A bayesian framework for quantifying uncertainty in stochastic simulation. Operations Research, 62, 1439–1452.
- Zouaoui and Wilson (2004) Zouaoui, F. and Wilson, J. R. (2004) Accounting for input-model and input-parameter uncertainties in simulation. IIE Transactions, 36, 1135–1151.
Appendix A Immediate Extensions from Section 3
A.1 Inference on Standard Error
We can conduct inference on the standard error of using Cheap Bootstrap. Here by standard error we mean the standard deviation of , which is asymptotically , and our inference target is . Using the same argument as in Section 3.1, we have that
| (31) |
is an asymptotically exact -level confidence interval for , where and are the and -quantiles of . We summarize this as follows.
Theorem 7 (Cheap Bootstrap interval for standard error).
A.2 Multivariate Generalization
We present a multivariate generalization of Cheap Bootstrap. Consider now . Our multivariate confidence region proceeds similarly as the univariate case, except we use Hotelling’s instead of . More specifically, we have point estimate , and we resample from to obtain and evaluate the resample estimate . Our confidence region is
| (32) |
where now denotes a matrix given by
| (33) |
and the critical value is the -quantile of Hotelling’s distribution with parameters and .
We have the following asymptotic exact guarantee for . First we make the following multivariate analog of Assumption 1:
Assumption 3 (Standard condition for multivariate bootstrap validity).
We have and conditional on the data in probability as , where is a multivariate normal vector with mean and covariance matrix that is positive definite.
Then we have:
Theorem 8 (Asymptotic exactness of multivariate Cheap Bootstrap).
Note that in Theorem 8 we require to be at least , the dimension of . In the univariate case this reduces to .
Finally, the following is a multivariate analog of Proposition 2 that uses Hadamard differentiability with non-degenerate derivative to ensure Assumption 3:
Proposition 4 (Sufficient conditions for multivariate bootstrap validity).
Consider and as random elements that take values in , where is a Donsker class with finite envelope. Suppose is Hadamard differentiable at where the derivative satisfies that the covariance matrix of is positive definite, for a tight Gaussian process on with mean 0 and covariance . Then Assumption 3 holds under i.i.d. data.
Appendix B Proofs for Section 3 and Appendix A
Proof of Theorem 2.
For convenience throughout the proof we use to denote a positive constant that is not necessarily the same every time it appears. We first define
and consider , where is the mean of a resample . We can view as the resample counterpart of .
Under the function-of-mean model described in the theorem, the pivotal statistic (7) can be written as
For a two-sided interval, coverage is defined by the event
or equivalently
Define as the conditional distribution of given the data . Note that we can write the coverage probability as
| (34) |
where the expectation is taken with respect to the data .
Consider a positive number . We first show that, with probability ,
| (35) |
where
| (36) |
is a random signed measure (constructed from the random polynomial ), and satisfies for some constant . Here, the polynomials are the ones defined in Theorem 14 (in Appendix F.3). To this end, denote as the event that
| (37) |
| (38) |
and
| (39) |
hold simultaneously. By Theorem 14, occurs with probability . Now, conditional on the data and for any ,
| (40) |
is expressible as for some . Thus, using the oddness and evenness property of in Theorem 13, we have, under ,
| (41) |
for some by (37). Thus, integrating (40) with respect to and using (41), we get
| (42) | |||||
where satisfies . Iterating (42), this time considering
and using Fubini’s theorem with the signed measure , we have
where satisfies
by (38) and (39) (where the last is a different constant from the previous one). Continuing in this fashion, we get
where each satisfies . This gives (35).
Now consider (34), which we can write as
| since | ||||
| by (35) |
Using (36), we write the first term in (B) as
| (44) | |||||
where the last equality follows by expanding out the product for , using the symmetry among to get the second term, and using (38) and (39) to get the last remainder term.
Next, we can write
| (45) | |||||
where and denote the same polynomial of bounded degree in or for , where the coefficients of the polynomial consist of linear combinations of terms in the form
for some positive integer , which is absolutely bounded by
for some constant independent of . Now, with for sufficiently large , uniform integrability gives the convergence on the power moments of sample moments, i.e.,
where and any . So we have
where in the inequality could be different from the previous .
Lastly, using Theorem 13, and a similar argument as before with Fubini’s theorem and the observation that
is expressible as for some , we have
| (49) | |||||
when . Similarly,
| (50) | |||||
Thus, using (49) and (50), we can write (48) as
| (51) |
which gives the first part of the theorem. Note that when , the remainder term in (49) is refined to and, as a result, the remainder term in (51) is refined to .
The second part of the theorem follows analogously by replacing the event with or . Consider now . Because of the aforementioned change of the considered event, now (36) is replaced by
and (44) becomes, in the upper interval case,
for giving a modified (48) as
| (52) |
when and . Moreover, (49) becomes
| (53) |
and (50) becomes
giving rise to a modified (51) as
| (54) |
which gives the upper interval case in second part of the theorem. The lower interval case follows analogously. Moreover, when and , the remainder term in (52) is refined to , the remainder term in (53) is refined to and, as a result, the remainder term in (54) is refined to . ∎
Proof of Theorem 7.
Appendix C Further Details for Section 4
C.1 Proofs for the Beginning of Section 4
Proof of Proposition 3.
We focus on as the argument for is the same. Suppose is Hadamard differentiable and satisfies the assumptions in Proposition 2. Then, by Proposition 2, Assumption 1 holds for and we have weakly converges to a tight random variable. Hence by the Slutsky theorem. Moreover, by Proposition 1, we also know weakly converges to a tight variable, and hence by the Slutsky theorem again. Thus, once again by the Slutsky theorem which concludes the proposition. ∎
Proof of Theorem 3.
We divide the proof into two steps:
Step 1. We first show the convergence of the following joint distribution
| (56) | |||||
where .
For convenience, denote
Also, denote and .
Then, we have, for any fixed real constants for ,
| (57) | |||||
| where refers to all the computation randomness in generating , | |||||
| by noting that and are determined solely by and | |||||
| by the triangle inequality | |||||
We consider the two terms in (57) one by one, and we consider the second term first. By conditioning on and telescoping, we have
| (58) | |||||
The first term in (58) can be bounded from above by
for some small , where the second term can be written as
for some constant by the Berry-Esseen theorem, which is further bounded from above by
for some constant , which follows from applying the mean value theorem to the function and noting that the function is bounded over . Hence, the first term in (58) is bounded from above by
| (59) |
Since and in Assumption 2, given arbitrary , we can choose a small enough , a large enough and a large enough such that (59) is bounded above by . Thus, the first term in (58) converges to 0 as . The second term in (58) converges to 0 as by Assumption 1. We therefore have the second term in (57) go to 0 as .
We handle the first term in (57) with a similar argument. We have
| (60) | |||||
| by noting that are determined solely by and | |||||
| by the triangle and Jensen inequalities | |||||
| by the conditional independence of given and that, | |||||
| given , is independent of for and and | |||||
| by the triangle inequality |
Note that in the first term in (60), each
converges to 0 as by the same argument as for the first term in (58), except that we use the bootstrapped moments and in Assumption 2 instead of and . The second term in (60) also goes to 0 as by Assumption 1 and the dominated convergence theorem.
Step 2. We consider the following decompositions
and
Then apply the continuous mapping theorem to get
This concludes the theorem. ∎
C.2 Proofs and Additional Discussions for Section 4.1
We first prove Theorem 4:
Proof of Theorem 4.
Consider the pivotal statistic . We argue that defined in (18) satisfies
which would conclude that is an asymptotically valid -level confidence interval.
To this end, by Theorem 3 and the continuous mapping theorem, as , converges weakly to
| (61) |
where . A direct inspection on the homogenity of the expression reveals that (61) only depends on and through their ratio. Multiplying by a factor on both the numerator and denominator, we rewrite (61) as
| (62) |
where and as defined before. We will see momentarily that (62) follows the same distribution as (19). For now, recall the distribution function of (19) is , which has the unknown . We have
where the third equality follows from the symmetry of (19) or (62).
To understand how the additional intricacy from the computation noise affects the interval half-width, we consider the scenario when grows. The asymptotic distribution of given by (19) becomes
| (63) |
with , since and a.s. in (19). Correspondingly, defined in (17) is distributed approximately as
| (64) |
which, when is large, becomes
So the half-width of behaves like
| (65) |
where is the maximum -quantile of (63) over all possible . Now, supposing we know the values of and , the normality confidence interval obtained from extracting the first component in the limit in (15) is
thus with a half-width
| (66) |
The standard error in this half-width has the notable interpretation of being a combination of the data variability and computation variability . Suppose in (65) we use , so that a resample estimate exhibits the same variability as the original estimate. Comparing (65) and (66), we see that (65) has an additional contribution coming from . If is not present, then becomes and becomes the quantile of which is a standard normal variable, since in this case the maximum quantile over all is approached by choosing . In other words, when is not present, we recover the normality interval half-width when increases. Thus, the added variability from can be viewed as a price we pay to handle the additional computation noise without knowledge on and .
C.3 Proofs and Additional Discussions for Section 4.2
We first prove Theorem 5:
Proof of Theorem 5.
The proof follows the roadmap of that of Theorem 4. Consider the pivotal statistic . We first argue that satisfies
which would conclude that is an asymptotically valid -level confidence interval.
By Theorem 3 and the continuous mapping theorem, as , converges weakly to
| (67) |
where , , , and which is independent of and . The equalities in distribution use the standard properties of normals to obtain and distributions. By multiplying both the numerator and denominator of (67) by , we get
| (68) |
where and as defined before. Denote the distribution of (68) as . We have
for any , by noting that the minimum is approached by setting when and attained at when . Thus setting gives
where the third equality follows from the symmetry of (68).
Finally, note that when (68) becomes regardless of the value of . Thus in this case is asymptotically , and asymptotic exactness of holds.
∎
Note that, in contrast to (61) where appears both in the numerator and denominator, in (67) only appears in the former and thus the numerator and denominator there are independent. This simplifies the asymptotic distribution to be used in .
We discuss the half-width efficiency of and contrast with . First, unlike , note that it is possible to have asymptotic exactness for as , in particular when we use the same computation size in the resample estimate and the original point estimate, which is a natural configuration. Moreover, from (24) and (67), we see that as increases, the half-width of behaves approximately as
When increases, this becomes
so that when we get
which is the half-width of the normality confidence interval (when is set to equal ). This conformance shows the superiority of over when is large. Nonetheless, when is small or when the computation sizes of the resample and original estimates are different, could possibly outperform .
Lastly, both and have natural one-sided analogs, where we replace and by and in one of the interval limits (and with the other side unbounded).
Appendix D Proofs for Section 5
Proof of Theorem 6.
In each of the three subsampling variants, we show that an analog of Assumption 1 holds and hence we can use the same roadmap as the proofs of Proposition 1 and Theorem 1 to conclude our result. Note that, under the assumptions in Proposition 2, we have immediately that for some by the functional delta method (Theorem 10 in Appendix F.2). Now, under the additional assumption that is measurable for every , we have the following:
Cheap -out-of- Bootstrap: Denote as a subsample estimate. We invoke Theorem 15 (in Appendix F.4) to conclude that given in probability as , for any dependent on such that and . Following the same argument in the proof of Proposition 1, except we replace by , we obtain
where are i.i.d. . Therefore,
by the continuous mapping theorem. Then, following the proof of Theorem 1 to note that the right hand side above is a -variable, we get
from which we conclude the result.
Cheap Bag of Little Bootstraps: Recall is the fixed subsample estimate, and denote as a second-layer resample estimate. Note that the subsample encoded by , which is obtained by sampling without replacement from the data encoded by , is distributed i.i.d. from . Thus we can involve Theorem 15 to conclude in probability, given and the subsampling randomness, as for any dependent on such that . The rest is identical to the proofs of Proposition 1 and Theorem 1, except we replace by and, instead of conditioning on in the series of inequalities in the proof of Proposition 1, we condition on both and the randomness in the subsampling that obtains .
Cheap Subsampled Double Bootstrap: Denote as a first-layer subsample estimate and as the derived second-layer resample estimate. We invoke Theorem 16 (in Appendix F.4) to conclude that given in probability as , for any dependent on such that and . The rest is identical to the proofs of Proposition 1 and Theorem 1, except we replace by . ∎
Appendix E Additional Numerical Results
E.1 Logistic Regression
We present another example on a logistic regression model where . We set and use data of size to fit the model and estimate the coefficients ’s. The ground truth is set as and the coefficients , a set of numbers arbitrarily chosen from the interval . Our setup is similar to the linear regression example in Section 6.2, where we test all methods to compute confidence intervals on the first coefficient , and use subsample size for -out-of- Bootstrap, Bag of Little Bootstraps and Subsampled Double Bootstrap. We again use resamples in total for each method to depict the trend.
Figures 6, 7 and 8 show the coverage probabilities, mean interval widths, and standard deviations of interval widths respectively for Standard and Cheap bootstrap methods. The comparisons are largely similar to the linear regression example. The Cheap bootstrap methods all attain close to the target coverage at , with , , and for Cheap Bootstrap, -out-of-, Bag of Little Bootstrap and Subsampled Double Bootstrap respectively. On the other hand, the Standard bootstrap methods all fail at and require much larger to approach the target coverage. Both the means and standard deviations of interval widths for Cheap bootstrap methods decrease sharply from (e.g., mean and standard deviation for Cheap Bootstrap) to (mean and standard deviation ), and continue to drop further at (mean and standard deviation ) and beyond at a continuously slower rate. On the other hand, the mean interval widths of Standard bootstrap methods are initially small and exhibit increasing trends, whereas the standard deviations appear roughly constant against . Thus, similar to the linear regression example, here Cheap bootstrap methods again consistently attain accurate coverage regardless of and their interval widths drop fast to levels comparable to large . On the other hand, Standard methods under-cover when is small and converge to the nominal level at much slower rates.


E.2 Critical Values for Cheap Bootstrap in Nested Sampling Problems
Table 5 shows the approximated for ranging from to and (and also for later use in the example in Appendix E.3) when , i.e., , where we also show for comparison. Note that when , only is well-defined but not . We also see that while is smaller than when is small, it appears that they are very similar as reaches .
| 1 | 12.75 | NA | 6.32 | NA |
|---|---|---|---|---|
| 2 | 4.32 | 12.71 | 2.92 | 6.31 |
| 3 | 3.19 | 4.30 | 2.36 | 2.92 |
| 4 | 2.78 | 3.18 | 2.14 | 2.35 |
| 5 | 2.57 | 2.78 | 2.02 | 2.13 |
| 6 | 2.45 | 2.57 | 1.95 | 2.02 |
| 7 | 2.37 | 2.45 | 1.90 | 1.94 |
| 8 | 2.31 | 2.36 | 1.86 | 1.89 |
| 9 | 2.27 | 2.31 | 1.84 | 1.86 |
| 10 | 2.23 | 2.26 | 1.82 | 1.83 |
| 11 | 2.21 | 2.23 | 1.80 | 1.81 |
| 12 | 2.19 | 2.20 | 1.79 | 1.80 |
| 13 | 2.16 | 2.18 | 1.78 | 1.78 |
| 14 | 2.15 | 2.16 | 1.77 | 1.77 |
| 15 | 2.14 | 2.14 | 1.76 | 1.76 |
| 16 | 2.12 | 2.13 | 1.75 | 1.75 |
| 17 | 2.11 | 2.12 | 1.74 | 1.75 |
| 18 | 2.11 | 2.11 | 1.74 | 1.74 |
| 19 | 2.10 | 2.10 | 1.73 | 1.73 |
| 20 | 2.09 | 2.09 | 1.73 | 1.73 |
E.3 Bagging Estimation for Bounding Optimality Gap
We apply the Cheap Bootstrap on a bagging method to construct upper confidence bounds for data-driven stochastic optimization problems. More specifically, consider an expected-value optimization problem where the distribution governing in the expectation is unknown and is only informed from data. The cost function is known or evaluatable, and denotes the feasible region for the decision variable . Such an optimization formulation appears broadly in multiple disciplines such as revenue management, portfolio selection, among others (e.g., Shapiro et al. (2021); Birge and Louveaux (2011)).
Suppose we have a given solution, say (which is presumably obtained from a data-driven procedure such as solving an empirical optimization or sample average approximation Shapiro et al. (2021)). To assess the quality of this given solution, we can construct an upper confidence bound for its optimality gap , where denotes the unknown true optimal value. To this end, a general upper bound for is given by where and denotes the corresponding expectation. The quantity
is a sample average approximation on cost function , which is equivalent to the difference between an empirical estimate of and a sample average approximation on itself. That is an upper bound for can be argued via the Jensen inequality and is a well-established optimistic bound in stochastic optimization (e.g., Mak et al. (1999), Glasserman (2004) §8).
To implement using data, Lam and Qian (2018a, b) suggest to use bagging. Namely, given data , where denotes the sample size (that could be different from ), we repeatedly resample data set and solve a sample average approximation , for . Then we output their average
to give a point estimate for . Cast in our framework in Section 4, we view where and each noisy computation run as where . Thus we can use the Cheap Bootstrap centered at original estimate and centered at resample mean in Section 4 to construct valid confidence bounds. Note that each computation run here involves solving a sample average approximation problem which could be costly.
To test the performance of our Cheap Bootstrap, we consider more specifically the following expected-value optimization problem
This is a -dimensional stochastic integer program, with binary decision variables . The true distribution of is , where and is an arbitrarily generated covariance matrix. We set and
This example is also used in Lam and Qian (2018b). We use the data size , and the size in sample average approximation . Throughout our set of experiments, we set which is obtained by solving a sample average approximation from an independent data set of size . We construct our one-sided Cheap Bootstrap intervals using and at (which corresponds to the case in Table 5), for ranging from to . We repeat our experiment times to obtain summary statistics on our generated bounds, including the one-sided empirical coverage, i.e., the proportion of experiments where our upper confidence bound is at least the ground true value, and the mean and standard deviation of the upper confidence bound.
Table 6 shows the results. We see that the empirical coverages range from to in all considered for Cheap Bootstrap centered at original estimate and centered at resample mean (note that the latter is defined only starting from ). The coverages are higher than the nominal value likely because the true value targeted by the confidence bound, namely , is itself an upper bound on the true optimality gap . The trends of the generated confidence bounds appear consistent with our previous examples. For centered at original estimate, the mean falls quickly from at to at , further to at and much more steadily to at , while the standard deviation falls from at to at , to at , and steadily to at . Similarly, for centered at resample mean, the mean falls quickly from at to at , and then steadily to at , while the standard deviation falls from at to at and steadily to at . The performance of centered at original estimate appears better than centered at resample mean for small but their performances are similar as reaches close to .
| Centered at original estimate | Centered at resample mean | |||
|---|---|---|---|---|
| Empirical coverage | Bound mean | Empirical coverage | Bound mean | |
| (margin of error) | (st. dev.) | (margin of error) | (st. dev.) | |
| 1 | 0.96 (0.01) | 2.83 (1.88) | NA | NA |
| 2 | 0.97 (0.01) | 1.91 (0.91) | 0.98 (0.01) | 2.79 (1.71) |
| 3 | 0.97 (0.01) | 1.72 (0.73) | 0.98 (0.01) | 1.84 (0.81) |
| 4 | 0.96 (0.01) | 1.67 (0.69) | 0.97 (0.01) | 1.72 (0.72) |
| 5 | 0.97 (0.01) | 1.64 (0.67) | 0.97 (0.01) | 1.66 (0.68) |
| 6 | 0.97 (0.01) | 1.61 (0.65) | 0.96 (0.01) | 1.62 (0.66) |
| 7 | 0.97 (0.01) | 1.60 (0.65) | 0.97 (0.01) | 1.60 (0.65) |
| 8 | 0.97 (0.01) | 1.58 (0.63) | 0.97 (0.01) | 1.58 (0.63) |
| 9 | 0.97 (0.01) | 1.58 (0.63) | 0.97 (0.01) | 1.57 (0.63) |
| 10 | 0.97 (0.01) | 1.58 (0.62) | 0.97 (0.01) | 1.56 (0.62) |
Appendix F Useful Technical Backgrounds
For self-containedness purpose, we provide some existing results needed for our technical developments.
F.1 Hadamard Differentiability
We give some details on Hadamard differentiability used in Proposition 2 and Theorem 6. Consider a functional , where denotes the space of probability distribution on the domain . We call Hadamard differentiable at with derivative , tangential to some subset of , if there exists a continuous, linear map such that
as for every sequence such that for any small and converging to (Van der Vaart (2000) §20.2).
F.2 Bootstrap Empirical Processes
We say that a sequence of random elements in a normed space , with norm denoted , converges in distribution to a tight limit in if
| (69) |
where is the set of all functions that are uniformly Lipschitz, i.e., for every pair , and denotes the outer expectation.
For a class of functions from to , define
where is a map from to . Consider the empirical process as a random element that takes value in , and consider the bootstrap empirical process . Supposing is Donsker with a finite envelope function, it is well established that in where is a tight Gaussian process (with mean 0 and covariance where denotes the covariance taken with respect to ). Denote as the expectation conditional on . We recall the following result for the bootstrap empirical process.
Theorem 9 (Adapted from Van der Vaart (2000) Theorem 23.7).
For every Donsker class of measurable functions with a finite envelope function,
Furthermore, the sequence is asymptotically measurable.
Next we recall two theorems:
Theorem 10 (Adapted from Van der Vaart (2000) Theorem 20.8).
Let be a normed space and be Hadamard differentiable at tangential to some subspace . Let be random maps with values in such that where takes values in . Then .
Theorem 11 (Adapted from Van der Vaart (2000) Theorem 23.9).
Let be a normed space and be Hadamard differentiable at tangential to some subspace . Let and be random maps with values in such that and , in which is asymptotically measurable and is tight and takes values in . Then conditionally given in probability.
In general, we say weakly converges to conditionally given in probability if the condition in Theorem 11 holds (Van der Vaart (2000) equation (23.8)). By Kosorok (2007) Lemma 10.11, in the case , this condition implies for all if the distribution function of is continuous.
The following theorem, which is an immediate consequence of the above results, is used to justify Propositions 2 and 4.
Theorem 12 (Delta method for empirical bootstrap).
Consider and as random elements that take values in , where is a Donsker class with a finite envelope. Suppose is Hadamard differentiable at (tangential to ). Then , and also given in probability.
F.3 Edgeworth Expansions
We have the following higher-order expansion of coverage probability for a general function-of-mean model:
Theorem 13 (Hall (2013) Theorem 2.2).
Assume that for an integer , the function has continuous derivatives in a neighborhood of , that , that , that the characteristic function of satisfies Cramer’s condition , and that the asymptotic variance of equals 1. Then
uniformly in , where is a polynomial of degree , odd for even and even for odd , with coefficients depending on moments of up to order polynomially and also .
In Theorem 13, is generally defined and the condition is satisfied by and defined in (9) and (10). When , we denote its as . When , we denote its as .
Now denote as but with all moments in its coefficients replaced by the sample moments, i.e., denoting , the moment
is replaced by
for sample . Specifically, in the case of , we denote as the with moments replaced by sample moments. Moreover, we also define
Then, , where for a resample , is the resample counterpart of . We have the following expansion and bounds for the resample counterpart:
Theorem 14 (Adapted from Hall (2013) Theorem 5.1).
Let be given, and let be a sufficiently large positive number. Assume that and each have bounded derivatives in a neighborhood of , that , and that the characteristic function of satisfies Cramer’s condition . Then there exists a constant such that
and
| (70) |
where denotes the data.
F.4 Subsampling
Consider where is the bootstrap empirical distribution constructed using resampled values from by sampling with replacement. Let , where is the canonical metric. The following result is useful for analyzing Cheap -out-of- Bootstrap and Cheap Bag of Little Bootstraps:
Theorem 15 (Adapted from Van der Vaart and Wellner (2013) Theorem 3.6.3).
Let be a Donsker class of measurable functions such that is measurable for every . Then
as , for any sequence , where denotes the expectation conditional on the data .
The following is useful for analyzing Cheap Subsampled Double Bootstrap:
Theorem 16 (Adapted from Sengupta et al. (2016) Theorem 1).
Let be a Donsker class of measurable functions such that is measurable for every . Then the Subsampled Double Bootstrap process defined by satisfies
as , where is with respect to the randomness of both the first and second-layer resampling in Subsampled Double Bootstrap, conditional on the data .