A catalogue of merging clusters of galaxies: cluster partners, merging subclusters, and post-collision clusters
Abstract
Clusters of galaxies are merging during the formation of large-scale structures in the Universe. Based on optical survey data, we identify a large sample of pre-mergers of galaxy clusters and merging subclusters in rich clusters. We find 39 382 partners within a velocity difference of 1500 km s-1 and a projected separation of 5 around 33 126 main clusters, where is the radius of the main cluster. Based on the galaxy distribution inside rich clusters with more than 30 member galaxy candidates, we identify subclusters by modeling the smoothed optical distribution with a two-component profile, and a coupling factor is obtained for merging subclusters in 7845 clusters. In addition, we find 3446 post-collision mergers according to the deviations of brightest cluster galaxies from other member galaxies, most of which have been partially validated by using the Chandra and XMM-Newton X-ray images. Two new bullet-like clusters have been identified by using the optical and X-ray images. The large samples of merging clusters of galaxies presented here are important databases for studying the hierarchical structure formation, cluster evolution, and the physics of intergalactic medium.
keywords:
catalogues — galaxies: clusters: general — large-scale structure of Universe1 Introduction
The hierarchical formation scenario of the large-scale structure suggests that larger structures are formed through the continuous merging of smaller structures (Springel et al., 2005). As the largest virialized systems in the Universe, clusters of galaxies were formed at the epoch of and grew through merging smaller clusters (Kravtsov & Borgani, 2012). The merging process results in obvious substructures or the non-spherical distribution of member galaxies and/or hot gas inside a cluster of galaxies, which can be used to reveal the dynamical state of clusters (Wen & Han, 2013) and test models for the structure formation of the Universe (West et al., 1988; Jing et al., 1995).
The merging process of galaxy clusters usually experiences several stages. Before the merger, two or more clusters have a large separation with only very weak gravitational interaction. These clusters may be located in a cosmological filament as suggested by the distribution of galaxies or diffuse gas (Porter et al., 2008; Zhang et al., 2013), which are good targets to reveal the missing baryon in the form of warm-hot intergalactic medium (Werner et al., 2008; Tejos et al., 2016; Mirakhor et al., 2022), and to study star formation history of galaxies around clusters (Gray et al., 2004; Porter et al., 2008; Piraino-Cerda et al., 2024). As two clusters approach but are not connected at the early stage of mergers, they have a stronger interaction with some gas partly mixed. Merging clusters at this stage generally have not yet produced shocks shown in X-ray images (e.g. Belsole et al., 2004; Kato et al., 2015) except few cases (e.g. Akamatsu et al., 2016; Gu et al., 2019). Afterward, two clusters experience mergers with an enormous amount of energy released. Strong shocks of intracluster hot gas are usually generated, which can transfer the dynamical energy in the intracluster medium (ICM) into non-thermal component (van Weeren et al., 2010; van Weeren et al., 2012; Macario et al., 2011; Russell et al., 2010). Radio observations reveal radio relics which are produced by particles accelerated to relativistic velocity in merging shock fronts, or radio halo by re-accelerated particles in the turbulence in the ICM (Feretti et al., 2012). The ICM in some merging subclusters can be stripped by the ram pressure. The extreme case of cluster merger, e.g. 1E 0657558 (the Bullet cluster, Markevitch et al., 2002), shows the significant offset between the matter and the ICM, which provides direct evidence of dark matter and constraint on the properties of dark matter (Markevitch et al., 2004; Clowe et al., 2006). After merging, the hot gas and member galaxies may experience long post-merging phase and gradually slow down towards a final relaxed state which is shown by a bright cool core in X-ray and a dominated brightest cluster galaxy (BCG) in optical (Vikhlinin et al., 2005; Wen & Han, 2015a; Lopes et al., 2018).
Merging clusters are indicated by substructures inside a cluster. About 40% – 70% of clusters show an obvious signature of recent mergers (Schuecker et al., 2001; Smith et al., 2005; Wen & Han, 2013). The dynamical states of galaxy clusters are direct indications of merging processes inside clusters and be quantified by the concentration index, the centroid shift, the power ratio, and the morphology index in X-ray images (Buote & Tsai, 1995; Mohr et al., 1995; Santos et al., 2008; Yuan & Han, 2020). In optical, it also can be diagnosed by the 3-D distribution of member galaxies (Dressler & Shectman, 1988; Yu et al., 2018) and the relaxation parameters based on the 2-D distribution of member galaxies (Wen & Han, 2013). The above measurements merely give the amount of the substructure for clusters without the information of merging stages, and hence are insufficient to describe the dynamical states of clusters.
Cluster mergers at different stages have been explored previously. A few tens of paired clusters and pre-merger systems have been individually studied by optical and X-ray data (e.g. Belsole et al., 2004; Sakelliou & Ponman, 2004; Planck Collaboration et al., 2013; Molino et al., 2019). Ongoing mergers have been identified for more than one hundred clusters through X-ray images (e.g. Kempner & David, 2004; Markevitch et al., 2005; Sakelliou & Ponman, 2006; Giacintucci et al., 2009; Boschin et al., 2012a) or observations of radio diffuse halos and relics (e.g. Feretti et al., 2012; van Weeren et al., 2019). Mann & Ebeling (2012) identified 10 clusters that likely have undergone recent multiple merger events and also 11 systems that are likely the post-collision of head-on mergers based on the projected offset between the BCG and the peak of X-ray emission, and also a visual assessment of the cluster morphology in optical and X-ray. By using Sloan Digital Sky Survey (SDSS) spectroscopic data release 12 (DR12), Tempel et al. (2017) found 498 potential partner systems for the galaxy groups in the redshift range of . Recently Oak & Paul (2024) presented an improved search algorithm for interacting galaxy clusters from the SDSS DR17 and published 160 merging systems and 21 pre-merging/post-merging systems at .
In recent years, a large number of galaxy clusters up to have been identified from the optical survey data, e.g. SDSS (Koester et al., 2007; Wen et al., 2009, 2012; Wen & Han, 2015b; Rykoff et al., 2014; Oguri, 2014; Banerjee et al., 2018), Dark Energy Spectroscopic Instrument (DESI) Legacy Imaging Surveys (Yang et al., 2021; Zou et al., 2022; Wen & Han, 2024) and Dark Energy Survey (DES; Rykoff et al., 2016; Wen & Han, 2022). These cluster samples, supplemented with spectroscopic or photometric data of galaxies in optical surveys, provide an unprecedentedly large database to reveal cluster mergers.
Optical imaging data can show cluster mergers projected on the sky plane and trace the mass distribution inside merging clusters since galaxies are essentially collisionless during mergers (e.g. Jee et al., 2015; Golovich et al., 2016; Finner et al., 2017). In this paper, we identify a large sample of merging clusters at different stages by using the large optical cluster sample from the DESI Legacy Surveys. In Section 2, we describe the cluster sample and the member galaxies. In Section 3, we obtain a large sample of pre-merger cluster partner systems. In section 4, we analyze the subclusters within the region of for rich clusters and quantify the merging process via a coupling factor. In section 5, we identify post-collision mergers from rich clusters according to the deviations of the BCGs from the distribution of other member galaxies. A summary is presented in Section 6.
Throughout this paper, we assume a flat Lambda cold dark matter (CDM) cosmology taking km s-1 Mpc-1, and .
| Name of partners | Name of cluster | R.A. | Dec. | |||||
|---|---|---|---|---|---|---|---|---|
| (1) | (2) | (3) | (4) | (5) | (6) | (7) | (8) | (9) |
| WHY-CP00001:M | WH24-J000000.5021911 | 0.00201 | 2.31980 | 0.4282 | 18.043 | 0.612 | 1.07 | 0.000 |
| WHY-CP00001:p1 | WH24-J000008.5022658 | 0.03525 | 2.44944 | 0.4279 | 18.215 | 0.672 | 0.94 | 2.695 |
| WHY-CP00002:M | WH24-J000002.3051718 | 0.00959 | 5.28825 | 0.1694 | 15.412 | 0.708 | 1.32 | 0.000 |
| WHY-CP00002:p1 | WH24-J000037.1053308 | 0.15451 | 5.55236 | 0.1701 | 16.228 | 0.643 | 0.89 | 3.132 |
| WHY-CP00003:M | WH24-J000004.2021941 | 0.01741 | 2.32799 | 0.6443 | 18.314 | 0.627 | 1.32 | 0.000 |
| WHY-CP00003:p1 | WH24-J000011.9021704 | 0.04961 | 2.28446 | 0.6439 | 18.473 | 0.538 | 1.04 | 1.344 |
| WHY-CP00004:M | WH24-J000009.8081846 | 0.04067 | 8.31275 | 0.4862 | 17.604 | 0.900 | 3.13 | 0.000 |
| WHY-CP00004:p1 | WH24-J000008.8082858 | 0.03665 | 8.48269 | 0.4849 | 18.019 | 0.497 | 0.73 | 3.677 |
| WHY-CP00005:M | WH24-J000014.2014424 | 0.05902 | 1.73990 | 0.7909 | 19.603 | 0.585 | 1.04 | 0.000 |
| WHY-CP00005:p1 | WH24-J000031.3014241 | 0.13023 | 1.71140 | 0.7933 | 19.997 | 0.487 | 0.55 | 2.061 |
| … | … | … | … | … | … | … | … | . |
Note.
Column (1): name of cluster partners: ‘-M’ stands for the main cluster, ‘-p1’ or ‘-p2’ and so on for partners;
Column (2): name of cluster;
Column (3): RA (J2000) of a cluster (degree);
Column (4): Decl. (J2000) of a cluster (degree);
Column (5): redshift of cluster;
Column (6): -band magnitude of BCG;
Column (7): cluster radius, , in Mpc;
Column (8): derived cluster mass, in ;
Column (9): projected distance to the main cluster, in Mpc.
(This table is available in its entirety in a machine-readable form.)


2 Galaxy clusters and member galaxies
This study uses the catalogue of 1.58 million galaxy clusters in the redshift range of identified by Wen & Han (2024) from the DESI Legacy Imaging Surveys (Dey et al., 2019) DR9 and new data from DR10, covering a total sky area of 24,000 deg2. Our algorithm first selects a sample of massive BCG-like galaxies with a stellar mass of , a high optical/infrared luminosity and a red colour defined by known BCGs. Then clusters are searched as being the overdensity peaks of galaxy stellar masses in the redshift slices around the massive BCG-like galaxies. The galaxies within a given redshift slice and a given projected separation from the BCG-like galaxies were taken as member galaxy candidates of clusters to-be-identified. The cluster redshifts were then determined from the photometric redshifts and available spectroscopic redshifts of member galaxy candidates. The cluster center is defined as being the position of the BCGs. The cluster radius (, the radius within which the mean density of a cluster is 500 times the critical density of the universe) and mass (, the cluster mass within ) were estimated from the total stellar masses of member galaxy candidates via the calibrated scaling relations. The clusters have a mass in the range of with an uncertainty of 0.2 dex. Among the 1.58 million clusters of galaxies, 338 841 clusters have spectroscopic redshifts, and the others have photometric redshifts with an uncertainty of about 0.01. Cross-matching with known clusters suggests that our cluster catalogue has a high purity of 97% at and contains 90% of X-ray clusters with . See details in Wen & Han (2024).
In this paper, we use the 338 841 clusters that have spectroscopic redshifts among the 1.58 million clusters for finding cluster partner systems at the pre-merger stage. The spectroscopic redshifts are mostly taken for the member galaxies from the 2MASS Redshift Survey at low redshifts and from the SDSS up to the intermediate redshifts.
From 27 685 rich clusters in the catalogue of 1.58 million clusters, which have more than 30 member galaxy candidates within , we find merging subclusters and post-collision mergers. These clusters have a mass in the range of with the median mass of . For this work, only massive galaxies with a stellar mass of within a projected radius of 3 Mpc are taken as member galaxy (candidates), if they have spectroscopic redshifts within a velocity difference of km s-1 from the cluster redshifts or in a photometric redshift slice according to the uncertainty of their photometric redshifts (Wen & Han, 2021). The spectroscopic data from the GAMA survey (Driver et al., 2022) have been used to test the accuracy and completeness of so-detected bright member galaxies. We found that 83% of the member galaxy candidates from photometric redshifts can be verified well by spectroscopic redshifts, and only about 8% of true members are missing by our algorithm.


3 Cluster partners
We first find cluster partner systems before merging, which contain two or more nearby clusters that are probably gravitationally bound together. The more massive one is called the main cluster, and the other(s) with a less mass are partners. To avoid any misidentifications, we find the cluster partner systems from the 338 841 clusters with spectroscopic redshifts.
Clusters in the partnership are identified with criteria of a small separation on the sky plane and a small velocity difference indicated by spectroscopic redshifts. We set a maximum projected separation of 5 of the main cluster, which is about the half turn-around radius of a cluster (Regos & Geller, 1989; Rines & Diaferio, 2006; Hansen et al., 2020). The velocity difference between the two partners is temporarily set to be less than 1500 km s-1, and then we use the two-body model for gravitational binding (Beers et al., 1982) to further constrain the velocity difference by,
| (1) |
where is the relative velocity along the line of sight, is the projected separation, is the total virial mass of the system, and is the angle between the line connecting two clusters and the plane of the sky. The right term of Eq. 1 has a maximum value of , hence the partners with are discarded.
From the 338 841 clusters, we find 39 382 partners for 33 126 main clusters as listed in Table 1, which satisfy the criteria for the partnership. Among them, 28 041, 4161, 737, 146, 29, 7, 4, and 1 main clusters have one, two, three, four, five, six, seven, and even nine partners, respectively. The projected distributions of member galaxies for three examples of partnerships with one, two, and three partners, respectively, are shown in Fig. 1. Not surprisingly, galaxies are concentrated inside each cluster or in the region between clusters. The distributions for the projected separation and the velocity difference of 39 382 partners from the main clusters are shown in Fig. 2, together with the histogram number distributions. Under the gravitational binding condition, most (97%) systems have a velocity difference of less than 1000 km s-1, and a smaller velocity difference is desired at a larger projected separation.
The sample of our identified partner systems includes the previously well-known double clusters, such as A21 – IVZw015 (Planck Collaboration et al., 2013; Piffaretti et al., 2011), A1095W – A1095E (Ge et al., 2016), A1560A – A1560B (Ulmer & Cruddace, 1982), 400dJ1359 – ZwCl1358.1 (Planck Collaboration et al., 2013; Piffaretti et al., 2011), A1882A – A1882B (Owers et al., 2013), and A2029 – A2033 (Gonzalez et al., 2018). However, some previously proposed double clusters, such as A2061 – 2067 (Pearson et al., 2014) and A1758N – A1758S (David & Kempner, 2004), cannot satisfy the criterion for the velocity difference for the gravitation binding (Eq. 1), and therefore are not listed in Table 1 as being cluster partner systems. Some close double clusters, e.g. A98N – A98S (Paterno-Mahler et al., 2014) and A1750N – A1750C (Bulbul et al., 2016), are not in our sample since they have a projected separation smaller than . They are considered as merging subclusters inside massive clusters in this work (see Section 4).
| ID | R.A. | Dec. | flagz | R.A.2 | Dec.2 | |||||||
|---|---|---|---|---|---|---|---|---|---|---|---|---|
| (1) | (2) | (3) | (4) | (5) | (6) | (7) | (8) | (9) | (10) | (11) | (12) | (13) |
| WH24-J000007.6155003 | 0.03175 | 0.1528 | 1 | 14.918 | 0.892 | 2.25 | 0.02523 | 0.19 | 1.79 | 0.71 | ||
| WH24-J000017.5090235 | 0.07307 | 0.6564 | 1 | 19.245 | 0.717 | 1.94 | 0.06336 | 0.25 | 0.58 | 0.39 | ||
| WH24-J000026.3215405 | 0.10957 | 0.1790 | 0 | 15.418 | 1.027 | 3.44 | 0.14325 | 0.67 | 1.66 | 0.02 | ||
| WH24-J000037.8681727 | 0.15750 | 0.6070 | 0 | 18.379 | 0.996 | 5.02 | 0.09934 | 0.84 | 1.63 | 0.17 | ||
| WH24-J000044.0085223 | 0.18353 | 0.8185 | 0 | 18.923 | 0.807 | 3.12 | 0.18279 | 0.32 | 1.08 | 0.31 | ||
| WH24-J000045.5460728 | 0.18979 | 0.8455 | 0 | 19.979 | 0.701 | 2.26 | 0.19294 | 0.21 | 1.37 | 0.52 | ||
| WH24-J000102.7051311 | 0.26138 | 0.7013 | 0 | 19.154 | 0.752 | 2.41 | 0.26529 | 0.34 | 1.19 | 0.09 | ||
| WH24-J000113.8332203 | 0.30742 | 0.2828 | 0 | 17.142 | 0.902 | 2.63 | 0.32454 | 0.87 | 1.84 | 0.00 | ||
| WH24-J000117.2031648 | 0.32184 | 0.2932 | 1 | 16.448 | 1.009 | 3.62 | 0.35485 | 0.60 | 1.11 | 0.11 | ||
| WH24-J000117.5051944 | 0.32308 | 0.2633 | 1 | 16.727 | 0.884 | 2.47 | 0.32858 | 0.31 | 0.93 | 0.28 |
Note.
Column (1): Name of merging cluster;
Column (2): RA (J2000) of BCG (degree);
Column (3): Decl. (J2000) of BCG (degree);
Column (4): redshift of cluster;
Column (5): flag for cluster redshift. ’1’ indicates spectroscopic redshift and ’0’
indicates photometric redshift;
Column (6): -band magnitude of the BCG;
Column (7): cluster radius, , in Mpc;
Column (8): derived mass in ;
Column (9)-(10): RA (J2000) and Decl. (2000) of the secondary subcluster;
Column (11): projected distance between the central subcluster and the secondary subcluster, in Mpc;
Column (12): mass ratio between the central subcluster and the secondary subcluster;
Column (13): coupling factor between the central cluster and the secondary subcluster.
(This table is available in its entirety in a machine-readable form.)
Clusters of galaxies are preferably located at the knots of filamentary large-scale structures in the Universe, and are preferably aligned together (Altay et al., 2006; Smargon et al., 2012). Here we investigate the alignment of the partner positions to the main clusters using the 4161 clusters with two partners, and find the preferential alignment. The distribution of the angles of two partners to the main cluster is shown in Fig. 3, showing peaks at about 20 – 30 degrees for similar directions of two partners and at 170 – 180 degrees for the opposite. The partners at around 70-80 degrees are 30% below the average.
We noticed that more massive clusters have a higher fraction with partners (see Fig. 4). Considering the completeness of cluster spectroscopic redshifts, for statistics, we use only these clusters in the region of SDSS Baryon Oscillation Spectroscopic Survey with a redshift of and a mass for this statistics because about 90% of such clusters in the catalogue of 1.58 million clusters have spectroscopic redshifts. Among the 338 841 clusters with spectroscopic redshifts in this specific region, we get 20 145 clusters in the partner systems and 40 038 isolated clusters. It is understandable that in the hierarchical cluster formation scenario massive clusters are preferably formed in a denser environment and are experiencing more merging processes than isolated clusters.
4 Merging subclusters inside massive clusters
Clusters of galaxies in merging processing usually contain distinct subclusters, which are not dynamically relaxed. Here we work on 27 685 rich clusters with more than 30 member galaxies, decompose the subclusters, and finally obtain a coupling factor for overlapping subclusters in 7845 rich clusters.
4.1 Subcluster decomposition based on optical data
To reveal the mass distribution of subclusters inside a massive cluster, weak lensing analysis is a very reliable approach but can be done only for a small number of massive clusters (e.g. Jee et al., 2015; Jee et al., 2016; Finner et al., 2017; Kim et al., 2021). The ICM in subclusters can be stripped and shocked in merging processing. Hence the X-ray images can show substructures directly but are not accurate for the mass distribution of merging clusters. The member galaxies, however, can be regarded as collisionless objects, and their distribution can be an excellent indicator for subclusters and the mass distribution projected on the sky plane.
Because member galaxies are discretely distributed, to reduce the Poisson uncertainty, we smooth the optical images by putting the member galaxies with a Gaussian kernel weighted by the stellar mass of each galaxy following Wen & Han (2013), as shown in Fig. 5. For example, the cluster A1758 shows two distinct merging subclusters from the distribution of galaxies in the DESI colour image111https://www.legacysurvey.org/viewer. The positions (RA, Dec.) of all member galaxies are transformed into the Cartesian coordinates (, ) centering around the BCG. To get a smoothed optical map, the surrounding area of 4 Mpc 4 Mpc is divided into 200 pixels 200 pixels. The stellar mass value of each pixel (,) can then be calculated by adding the weighted Gaussian kernels for all member galaxies:
| (2) |
where is the stellar mass of the th member galaxy, and are the coordinates of the th member galaxy, is the total number of member galaxies within the region of 4 Mpc 4 Mpc and is a two-dimensional Gaussian function with a smooth scale of ,
| (3) |
The structures shown on the smoothed optical map depend on the smoothing scale of the Gaussian function. The smooth scale should be adopted to match the diffuse distributions between member galaxies and the underlying matter in clusters. A smaller scale leads to more discrete false subclusters, but a larger scale could smear out more real subclusters. Dawson et al. (2015) carried out the Merging Cluster Collaboration (MC2) project and performed a kernel density estimation (KDE) to model the light distribution of ongoing merging clusters. A smooth scale is obtained by maximizing the likelihood of fit between the KDE model and the data, which is in the range of 0.07–0.15 for several massive clusters (Jee et al., 2015; Jee et al., 2016; Golovich et al., 2016, 2017; Finner et al., 2017). Here we adopt a smooth scale of to construct the smoothed optical map (see Appendix A). The background and fluctuations are obtained from the region outside of 1.5 .


We then decompose the smoothed optical map to recognize subclusters. From the limited number of member galaxies, the smoothed map always contains many clumps. We work on the two dominant subclusters from the highest peaks on the smoothed map within and with a signal-to-noise greater than 10. The central subcluster contains the BCG, and the secondary is located aside, see Fig. 5 for example. Afterward, the smoothed map is fitted to a dual-King model:
| (4) | |||||
The first term is for the central subcluster and the second term is for the secondary. and are the stellar mass values at the centers of two components, and are their core radii, respectively, and is the relative position of the secondary subcluster to the central one. The total stellar mass of each subcluster is then obtained by the best-fitted King model, denoted as for the central subcluster, and for the secondary. In most clusters, the central subcluster is more massive. Nevertheless, in some cases the secondary subcluster could be more massive. The mass ratio between two subclusters is then calculated as being
| (5) |
If the central subcluster is more massive, the mass ratio is . Otherwise, . A cluster showing two distinct subclusters with a comparable stellar mass should have a mass ratio near 1.0. The mass ratio for our selected rich clusters has a distribution shown in Fig. 6. We limit the merging clusters to those showing subclusters with a mass ratio of for reliability of subcluster identification, so we have 7845 clusters listed in Table 2.
4.2 The coupling factor between subclusters
Subclusters are merging at various stages. At the early stage of a merger, they are separated. As the two subclusters approach and merge, they partly overlap together more and more, so that more galaxies between the subclusters could be mixed in the superposition area between them, Here we define a coupling factor for the two subclusters to show the merging stage based on the smoothed optical map. As shown in the middle panel of Fig. 5, we first find the minimum stellar mass on the connection line between two peaks, and then the coupling factor is defined by
| (6) |
here and are the peak values of two subclusters, respectively. A larger value of indicates a more significant overlapping between the central and the secondary subclusters. The coupling factors for 7845 massive clusters are listed in Table 2, and the distribution of is shown in Fig. 6.


4.3 Different merging signatures shown by galaxy distribution and hot gas
Both the member galaxies and hot intracluster gas can trace the gravitational potential inside clusters. However, member galaxies often have a different distribution from that of the hot gas (Yuan et al., 2023). We here compare the subclusters seen from our optical analysis with those shown in the X-ray images obtained by Yuan & Han (2020) and Yuan et al. (2022) from observations by the Chandra (Weisskopf et al., 2000) and XMM-Newton (Strüder et al., 2001). The X-ray images have been smoothed by a Gaussian function with a scale of 30 kpc. We cross-match the 7845 rich clusters are listed in Table 2 with the X-ray cluster sample, and get 153 X-ray clusters, 35 with Chandra images and 118 with XMM-Newton images. In Fig. 12 in the Appendix, we show the smoothed optical map of member galaxies overlaid with X-ray contours for these clusters sorted by the coupling factor.
For clusters with a small coupling factor of , the identified subclusters have a large separation, e.g. A1750, A689, RXC J1003.0+3254, A750, A2933, A2051, A1035, A2028, A2507, A98 and MCXC J1419.8+0634, which show double X-ray components from each optical subcluster, without interacting features between subclusters. They should be at the early stage of merging, as claimed for the clusters, e.g. A1750 (Belsole et al., 2004) and A98 (Paterno-Mahler et al., 2014).
Subclusters overlap more significantly with a larger coupling factor for a deeper merging, showing more features from the mixed ICM in X-ray images. During subcluster merging, the intracluster gas can be stripped from one subcluster. Most clusters with have only one main disturbed X-ray component, indicating that they are at the later merging stage. Subcluster collisions may cause the displacements between the member galaxies (and underlying dark matter) and gas (Ichinohe et al., 2015; Okabe et al., 2011; Russell et al., 2012; O’Hara et al., 2004; Zhang et al., 2021). The comparison between optical distribution for subclusters and X-ray images for intracluster gas shows that the X-ray emission of one subcluster is sometimes completely absent or very weak compared to the secondary in the clusters, e.g. A3771, ACT J0102-4915, SPTCL J0354-5904, MCXC J1311.7+2201, MCXC J0336.8-2804, A3921, APMCC772, A2069, ZwCl1742.1+3306, MS2215.7-0404, A665, A1443, A1240, A2146, A961, A3984, A85, MCXC J0510.7-0801, MACSJ0417.5-1154, A2163, A223, and A1201, indicating ongoing mergers responsible for the gas stripping, with obviously disturbed X-ray morphologies.
The most interesting among them is A223, very special for the weaker X-ray emission from the more massive central subcluster (Dietrich et al., 2005). Similar cases we find are A523, A2069, MS2215.7-0404, A3984, PSZ2G225.93-19.99, PSZ2G239.27-26.01, A141 and A2163.
Some clusters, e.g. A168, A2255, A2443, PSZ1G295.60-51.95 and PSZ2G314.26-55.35, show an elongated X-ray morphology or a stripped gas tail, indicating that they are probably at the stage of post-collision on the sky plane, as we will discuss below in details.
| Name | R.A. | Dec. | flagz | R.A.C | Dec.C | Note | ||||||
|---|---|---|---|---|---|---|---|---|---|---|---|---|
| (1) | (2) | (3) | (4) | (5) | (6) | (7) | (8) | (9) | (10) | (11) | (12) | (13) |
| WH24-J000003.1033245 | 0.01275 | 0.5973 | 1 | 18.010 | 0.851 | 3.20 | 0.03489 | 4.6 | 6.2 | 0 | ||
| WH24-J000007.6155003 | 0.03175 | 0.1528 | 1 | 14.918 | 0.892 | 2.25 | 0.03161 | 7.7 | 25.9 | 0 | ||
| WH24-J000023.4280612 | 0.09770 | 0.2822 | 0 | 15.744 | 1.039 | 3.92 | 0.14379 | 2.7 | 3.0 | 0 | ||
| WH24-J000037.8681727 | 0.15750 | 0.6070 | 0 | 18.379 | 0.996 | 5.02 | 0.09718 | 3.1 | 7.4 | 0 | ||
| WH24-J000055.7071235 | 0.23225 | 0.5515 | 1 | 18.338 | 0.811 | 2.29 | 0.22204 | 4.5 | 15.1 | 0 | ||
| WH24-J000113.8332203 | 0.30742 | 0.2828 | 0 | 17.142 | 0.902 | 2.63 | 0.25904 | 10.2 | 3.2 | 0 | ||
| WH24-J000117.2031648 | 0.32184 | 0.2932 | 1 | 16.448 | 1.009 | 3.62 | 0.36384 | 4.9 | 3.3 | 0 | ||
| WH24-J000126.3000143 | 0.35969 | 0.2490 | 1 | 15.798 | 1.073 | 4.47 | 0.29256 | 2.9 | 9.9 | 0 | ||
| WH24-J000156.4560937 | 0.48500 | 0.3041 | 0 | 16.366 | 1.077 | 4.69 | 0.49819 | 3.0 | 7.4 | 0 | ||
| WH24-J000212.4032509 | 0.55172 | 0.7247 | 1 | 19.115 | 0.764 | 2.54 | 0.55274 | 6.5 | 8.4 | 0 |
Note.
Column (1): Cluster name;
Column (2): RA (J2000) of BCG (degree);
Column (3): Decl. (J2000) of BCG (degree);
Column (4): redshift of the cluster;
Column (5): flag for cluster redshift. ’1’ indicates spectroscopic redshift and ’0’
indicates photometric redshift;
Column (6): -band magnitude of the BCG;
Column (7): cluster radius, , in Mpc;
Column (8): derived mass, in ;
Column (9)-(10): RA and Decl. of the ‘C’ galaxy as being the subcluster BCG;
Column (11): overdensity factor around the cluster BCG;
Column (12): overdensity factor around the ‘C’ galaxy;
Column (13): It is ’1’ if the post-collision merger has X-ray data from Chandra and XMM-Newton, otherwise ’0’.
(This table is available in its entirety in a machine-readable form.)
5 Post-collision mergers of clusters
Cluster merging at the post-collision stage is most intriguing for many aspects, e.g. dark matter distribution, electron acceleration, synchrotron radiation and the ICM heating (Markevitch et al., 2004; Feretti et al., 2012). Some post-collision clusters have been recognized previously from X-ray images based on highly elongated features, the shock front with a sharp edge of X-ray surface brightness, and the stripped gas tails (Markevitch & Vikhlinin, 2007; Russell et al., 2010; Menanteau et al., 2012; Jee et al., 2015). Here we identify post-collision merging clusters based on the two-dimensional distribution of member galaxies on the sky plane.
5.1 Identification of post-collision mergers
When two clusters collide, the mass distributions of the two clusters are reshaped. The member galaxies can be stripped out from the original clusters under gravitational force and probably also have an elongated spatial distribution in a new merging cluster. The BCG location should also deviate from the number density peak of the member galaxies (Bradač et al., 2006; Golovich et al., 2017; Jee et al., 2014; Maurogordato et al., 2008), and the member galaxies of two merging subclusters are not a simple superposition of two groups of galaxies. After the collision of two clusters, galaxies should have an excessive density in the region between the BCGs of two original clusters. We therefore identify the post-collision merging cluster from the above mentioned 27 685 rich clusters by finding the excessive density via the following steps (see Fig. 7):
1. Find the potential BCGs of two original clusters which are the colliding subclusters inside a rich cluster. We try all BCG-like galaxies (see Wen & Han, 2024, for details) within as being the potential BCGs of the colliding subclusters. The BCG-like galaxies are selected to have a stellar mass of , a high optical/infrared luminosity and a red colour which are defined by known BCGs from Abell clusters (Lauer et al., 2014), WHL and WH22 clusters (Wen et al., 2012; Wen & Han, 2015b, 2022). We mark the potential BCGs of the colliding subclusters by ’C’, and do the following tests. If a rich cluster does not have such a ’C’ galaxy in addition to the recognized central BCG, it is skipped for the identification of post-collision mergers.
2. Divide the sky region near the BCG and the ’C’ galaxy and find the galaxy mass distribution. For a cluster with the BCG and the ’C’ galaxy, we rotate the positions of member galaxies so that the ’C’ galaxy is located in the northwest direction with a position angle of degree. As shown in Fig. 7, we then divide the local region near the BCG and the ’C’ galaxy into seven square sub-regions with the same size on each side, with the diagonal length being the distance between them. The subregion No.1 is the common region between the BCG and the ’C’ galaxy. The sub-regions No.2, 3, and 4 are aside from the BCG, and the sub-regions No.5, 6, and 7 are aside from the ’C’ galaxy.
If in the sub-region No.1, there are less than 8 recognized member galaxies, i.e. , the cluster is skipped for the post-collision mergers to avoid large Poisson noise. If there are more than 8 member galaxies, we get the total stellar mass of member galaxies in these seven sub-regions, denoted as being (1, 2, 3, 4, 5, 6 and 7). Here the BCG and the ’C’ galaxy are not included in these mass calculations.
3. Find rich clusters with over-dense subregion No.1. The post-collision mergers in principle contain more galaxies in the sub-region No.1 than other sub-regions. We need to compare its total stellar mass with those of three sub-regions near the BCG (i.e. regions No.2, No.3 and No.4 in Fig. 7), and then with those of three sub-regions No. 5 ,6 and 7 near the ’C’ galaxy. We define the overdensity factor as
| (7) |
| (8) |
If two symmetric clusters with a similar mass are simply overlapped, we would get and . Here the post-collision mergers are recognized with the criteria of both and , which ensures that the stellar mass density from member galaxies between the two original BCGs is more enhanced than the simple sum of the two original clusters.
4. Finally, as we test for all bright galaxies as potential BCGs of subclusters, we get the final catalogue of post-collision mergers. For a cluster with more than two ’C’ galaxies satisfying the above criteria, the ’C’ galaxy with the largest is adopted. We finally get 3446 rich clusters with post-collision merging features, as listed in Table 3.


5.2 Verification of post-collision mergers by X-ray images
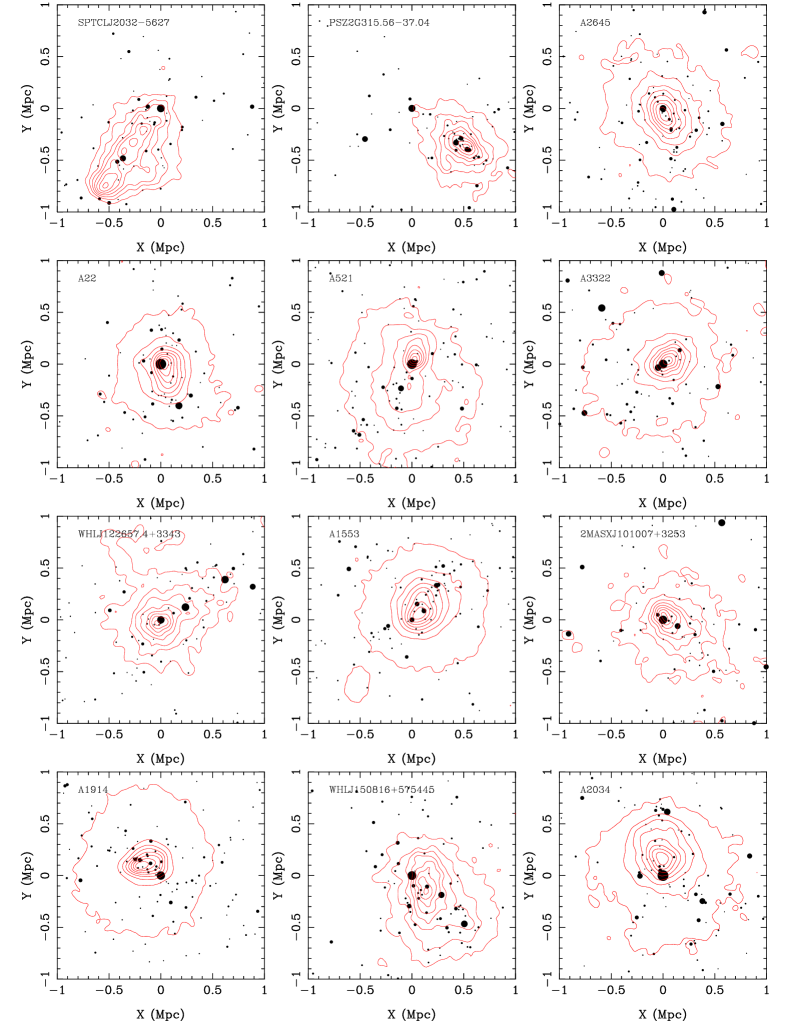
We validate the post-collision mergers in Table 3 by checking X-ray images, as done in Section 4.3. Cross-matching with the X-ray cluster sample in Yuan et al. (2022), we get the Chandra and XMM-Newton images for 152 clusters (39 from the Chandra and 113 from the XMM-Newton) as listed in Table 3, and all of them are shown in Fig. 13. About 90% of clusters show post-collision features in X-ray images, suggesting that our method efficiently recognizes post-collision mergers of clusters, with many interesting cases and some exceptions as discussed below.
Some clusters, e.g. A141, A168, A384, A520, A1240, A1553, A1914, A2034, A2443, A2645, A521, the Bullet, MCXC J0510.7-0801, MACS J1006.9+3200, PSZ1G295.60-51.95, SPTCLJ2032-5627, WHL J125941+600305 and WHL J120735.9+525459, have distinct offsets between their BCGs and the X-ray emission peaks, indicating the separations of the ICM and dark matter during the cluster collision. The sharp edges of the X-ray images indicate the front shock of post-collision mergers.
Some clusters, e.g. A68, A222, A1201, A2345, A2410, A2507, A329, A3399, MCXC J0244.1-2611, WHL J122657.4+3343, PSZ2G314.26-55.35, PSZ2G207.88+81.31 and 2MASXJ101007+3253, have X-ray peaks coincident with the BCG or the second BCG. The tail feature of the X-ray emission indicates a bulk flow of the ICM, which is the indication of clusters in an off-axis collision.
Diffuse radio halos or relics have been detected from some of these clusters, e.g. A209, A520, A521, A1240, A1351, A1914, A2034, A2254, A2255, A2443, the Bullet and ZwCl 2341.1+0000 (Feretti et al., 2012), A141 (Duchesne et al., 2021b), A168 (Dwarakanath et al., 2018), A2645 (Knowles et al., 2022), AS1063 (Rahaman et al., 2021), PSZ2G057.61+34.93 (Locatelli et al., 2020) and SPT-CL J2032-5627 (Duchesne et al., 2021a), which are signatures for the ongoing mergers.
We noticed, however, that some clusters, e.g. PSZ2G204.10+16.51, A2051, AS974, A611, A1084, A2055, and A2261, show a regular and concentrated X-ray emission around one subcluster as if in a relaxed dynamical state. Our optical galaxy luminosity distribution analysis suggests that they are in the post-merger stage. Possibly these clusters are experiencing an off-axis minor merger, which is not powerful enough to destroy the bright X-ray core of one cluster, as in A2261 shown from X-ray and radio data (Sommer et al., 2017). Otherwise, they are probably clusters in the sky due to the projection effect.
All in all, these 3446 rich clusters with post-collision features in the galaxy distribution are interesting objects worth follow-up.
5.3 Two newly identified bullet-like clusters
The Bullet cluster (Markevitch et al., 2002) is an extremely great example of post-collision mergers, which has a bullet-like subcluster moving away from the more massive subcluster with a high speed indicated by a prominent bow-like shock in X-ray. According to simulations (Hayashi & White, 2006; Kraljic & Sarkar, 2015), the bullet-like clusters are rare in the Universe. Up to now, only a few such cases have been found, including A2146 (Russell et al., 2010), Abell 3376 (Bagchi et al., 2006), ACT-CL J0102-4915 “El Gordo” (Menanteau et al., 2012), ZwCl 0008.8+5215 (Golovich et al., 2017), RXC J2359.3-6042 (Chon & Böhringer, 2015) and SPT-CL J2032-5627 (Duchesne et al., 2021a).
We get the plots of SPT-CL J20325627 in Fig. 8. Duchesne et al. (2021a) have showed the bullet-like structure in the X-ray image and detected the double radio relics at the southeast and northwest of this cluster. We find that SPT-CL J20325627 has an elongated distribution of member galaxies (middle panel of in Fig. 8) extracted from the optical data, and the smoothed map shows two distinct subclusters (right panel of in Fig. 8). The northwest subcluster hosts the first BCG and is more massive than the southeast subcluster with a mass ratio of 2.07. The optical and X-ray images suggest that this cluster is a very unusual merger. In a post-collision merger, the X-ray emission peak is expected to be located between the merging subclusters (Clowe et al., 2006; Monteiro-Oliveira et al., 2018). However, the XMM-Newton image of this cluster shows that the X-ray emission peak is leading both subclusters. The projected separation between the X-ray peak and the optical peak of the smaller subcluster is as large as 304 kpc, indicating a very significant offset between ICM and dark matter, similar to the Bullet cluster (Clowe et al., 2006).
With such post-collision features, we find two new bullet-like clusters among our galaxy clusters, PSZ1 G295.6051.95 at and WHL J125941600305 at , see Fig. 9 for the optical images overlaid with the X-ray emission detected by the XMM-Newton and the Chandra as processed by Yuan & Han (2020) and Yuan et al. (2022).
The optical colour image shows that PSZ1 G295.6051.95 contains several luminous galaxies. The XMM-Newton X-ray data show a head-tail morphology with a sharp brightness edge. The first BCG (east circle) is located in the tail with very faint X-ray emission. The west subcluster is associated with the X-ray emission peak which is ahead of the second BCG. The offset between the closer second BCG and the X-ray peak is 79.7 kpc. These features indicate that the ICM is rapidly moving from the east to the west, and the ICM in the east subcluster has been stripped during the cluster merger. Hence, PSZ1 G295.60-51.95 is a bullet-like cluster.
WHL J125941600305 also has a head-tail morphology in X-ray emission detected by the Chandra, and shows two luminous BCGs in the optical image. The X-ray peak is located at the edge of the contours with a sharp brightness in the southeast, and it has an offset of 55.5 kpc from the first BCG. The X-ray emission around the other BCG is much weaker. These features suggest that WHL J125941600305 is also a bullet-like cluster.
6 Summary
We present large samples of cluster mergers according to the optical properties of a large sample of galaxy clusters identified from the DESI Legacy Surveys data. By searching nearby clusters, we identify a sample of 39 382 partner clusters for 33 126 main clusters within a projected distance of 5 . About 97% partners have a velocity difference of 1000 km s-1 from the main clusters. For rich clusters with more than 30 member galaxies, we analyze the subclusters by smoothing the optical stellar mass distribution and then fit them with the dual-King model. We define the coupling factor to quantify the merging status for 7845 rich clusters. Based on the projected distribution of member galaxies, we further develop a new approach to recognize 3446 rich clusters with post-collision features, some of which have been validated by using X-ray images.
Such large samples of merging clusters of galaxies are important databases for studying the hierarchical structure formation, cluster evolution, and the physics of intergalactic medium. The partner systems are objects for the study of the process in the pre-merger stage, the material between clusters, and the structure formation. The mergers in the rich clusters can help to understand the violent process of cluster formation, diffuse radio emission, and properties of dark matter.
Acknowledgements
We thank the referee for valuable comments that helped to improve the paper. The authors are supported by the National Natural Science Foundation of China (Grant Numbers 11988101, 11833009 and 12073036), the Key Research Program of the Chinese Academy of Sciences (Grant Number QYZDJ-SSW-SLH021). We also acknowledge the support by the science research grants from the China Manned Space Project with Numbers CMS-CSST-2021-A01 and CMS-CSST-2021-B01.
The DESI Legacy Imaging Surveys consist of three individual and complementary projects: the Dark Energy Camera Legacy Survey (DECaLS), the Beijing-Arizona Sky Survey (BASS), and the Mayall z-band Legacy Survey (MzLS). DECaLS, BASS and MzLS together include data obtained, respectively, at the Blanco telescope, Cerro Tololo Inter-American Observatory, NSF’s NOIRLab; the Bok telescope, Steward Observatory, University of Arizona; and the Mayall telescope, Kitt Peak National Observatory, NOIRLab. NOIRLab is operated by the Association of Universities for Research in Astronomy (AURA) under a cooperative agreement with the National Science Foundation. Pipeline processing and analyses of the data were supported by NOIRLab and the Lawrence Berkeley National Laboratory (LBNL). Legacy Surveys also uses data products from the Near-Earth Object Wide-field Infrared Survey Explorer (NEOWISE), a project of the Jet Propulsion Laboratory/California Institute of Technology, funded by the National Aeronautics and Space Administration. Legacy Surveys was supported by: the Director, Office of Science, Office of High Energy Physics of the U.S. Department of Energy; the National Energy Research Scientific Computing Center, a DOE Office of Science User Facility; the U.S. National Science Foundation, Division of Astronomical Sciences; the National Astronomical Observatories of China, the Chinese Academy of Sciences and the Chinese National Natural Science Foundation. LBNL is managed by the Regents of the University of California under contract to the U.S. Department of Energy. The complete acknowledgments can be found at https://www.legacysurvey.org/acknowledgment/.
Funding for the Sloan Digital Sky Survey IV has been provided by the Alfred P. Sloan Foundation, the U.S. Department of Energy Office of Science, and the Participating Institutions. SDSS acknowledges support and resources from the Center for High-Performance Computing at the University of Utah. The SDSS web site is www.sdss4.org. SDSS is managed by the Astrophysical Research Consortium for the Participating Institutions of the SDSS Collaboration including the Brazilian Participation Group, the Carnegie Institution for Science, Carnegie Mellon University, Center for Astrophysics — Harvard & Smithsonian (CfA), the Chilean Participation Group, the French Participation Group, Instituto de Astrofísica de Canarias, The Johns Hopkins University, Kavli Institute for the Physics and Mathematics of the Universe (IPMU) / University of Tokyo, the Korean Participation Group, Lawrence Berkeley National Laboratory, Leibniz Institut für Astrophysik Potsdam (AIP), Max-Planck-Institut für Astronomie (MPIA Heidelberg), Max-Planck-Institut für Astrophysik (MPA Garching), Max-Planck-Institut für Extraterrestrische Physik (MPE), National Astronomical Observatories of China, New Mexico State University, New York University, University of Notre Dame, Observatório Nacional / MCTI, The Ohio State University, Pennsylvania State University, Shanghai Astronomical Observatory, United Kingdom Participation Group, Universidad Nacional Autónoma de México, University of Arizona, University of Colorado Boulder, University of Oxford, University of Portsmouth, University of Utah, University of Virginia, University of Washington, University of Wisconsin, Vanderbilt University, and Yale University.
This work also uses observations obtained with XMM–Newton, an ESA science mission with instruments and contributions directly fundedby the ESA Member States and the National Aeronautics and Space Administration (NASA). This research has used data obtained from the Chandra Data Archive and the Chandra Source Catalogue, and software provided by the Chandra X-ray Center (CXC) in the application packages CIAO, CHIPS and SHERPA.
Data availability
We publish the full tables for 33 126 cluster partner systems, 7845 clusters with distinct subclusters and 3446 post-collision mergers. They are also publicly available at http://zmtt.bao.ac.cn/galaxy_clusters/.
References
- Akamatsu et al. (2016) Akamatsu H., et al., 2016, A&A, 593, L7
- Altay et al. (2006) Altay G., Colberg J. M., Croft R. A. C., 2006, MNRAS, 370, 1422
- Bagchi et al. (2006) Bagchi J., Durret F., Neto G. B. L., Paul S., 2006, Science, 314, 791
- Banerjee et al. (2018) Banerjee P., Szabo T., Pierpaoli E., Franco G., Ortiz M., Oramas A., Tornello B., 2018, New Astron., 58, 61
- Barrena et al. (2009) Barrena R., Girardi M., Boschin W., Dasí M., 2009, A&A, 503, 357
- Barrena et al. (2022) Barrena R., Böhringer H., Chon G., 2022, A&A, 663, A78
- Beers et al. (1982) Beers T. C., Geller M. J., Huchra J. P., 1982, ApJ, 257, 23
- Belsole et al. (2004) Belsole E., Pratt G. W., Sauvageot J.-L., Bourdin H., 2004, A&A, 415, 821
- Benson et al. (2017) Benson B., Wittman D. M., Golovich N., Jee M. J., van Weeren R. J., Dawson W. A., 2017, ApJ, 841, 7
- Boschin et al. (2012a) Boschin W., Girardi M., Barrena R., Nonino M., 2012a, A&A, 540, A43
- Boschin et al. (2012b) Boschin W., Girardi M., Barrena R., 2012b, A&A, 547, A44
- Bradač et al. (2006) Bradač M., et al., 2006, ApJ, 652, 937
- Bulbul et al. (2016) Bulbul E., et al., 2016, ApJ, 818, 131
- Buote & Tsai (1995) Buote D. A., Tsai J. C., 1995, ApJ, 452, 522
- Chon & Böhringer (2015) Chon G., Böhringer H., 2015, A&A, 574, A132
- Clowe et al. (2006) Clowe D., Bradač M., Gonzalez A. H., Markevitch M., Randall S. W., Jones C., Zaritsky D., 2006, ApJ, 648, L109
- David & Kempner (2004) David L. P., Kempner J., 2004, ApJ, 613, 831
- Dawson et al. (2015) Dawson W. A., et al., 2015, ApJ, 805, 143
- Dey et al. (2019) Dey A., et al., 2019, AJ, 157, 168
- Dietrich et al. (2005) Dietrich J. P., Schneider P., Clowe D., Romano-Díaz E., Kerp J., 2005, A&A, 440, 453
- Dressler & Shectman (1988) Dressler A., Shectman S. A., 1988, AJ, 95, 985
- Driver et al. (2022) Driver S. P., et al., 2022, MNRAS, 513, 439
- Duchesne et al. (2021a) Duchesne S. W., Johnston-Hollitt M., Bartalucci I., Hodgson T., Pratt G. W., 2021a, Publ. Astron. Soc. Australia, 38, e005
- Duchesne et al. (2021b) Duchesne S. W., Johnston-Hollitt M., Wilber A. G., 2021b, Publ. Astron. Soc. Australia, 38, e031
- Dwarakanath et al. (2018) Dwarakanath K. S., Parekh V., Kale R., George L. T., 2018, MNRAS, 477, 957
- Feretti et al. (2012) Feretti L., Giovannini G., Govoni F., Murgia M., 2012, A&ARv, 20, 54
- Finner et al. (2017) Finner K., et al., 2017, ApJ, 851, 46
- Ge et al. (2016) Ge C., Wang Q. D., Tripp T. M., Li Z., Gu Q., Ji L., 2016, MNRAS, 459, 366
- Giacintucci et al. (2009) Giacintucci S., Venturi T., Cassano R., Dallacasa D., Brunetti G., 2009, ApJ, 704, L54
- Golovich et al. (2016) Golovich N., Dawson W. A., Wittman D., Ogrean G., van Weeren R., Bonafede A., 2016, ApJ, 831, 110
- Golovich et al. (2017) Golovich N., van Weeren R. J., Dawson W. A., Jee M. J., Wittman D., 2017, ApJ, 838, 110
- Gonzalez et al. (2018) Gonzalez E. J., et al., 2018, A&A, 611, A78
- Gray et al. (2004) Gray M. E., Wolf C., Meisenheimer K., Taylor A., Dye S., Borch A., Kleinheinrich M., 2004, MNRAS, 347, L73
- Gu et al. (2019) Gu L., et al., 2019, Nature Astronomy, 3, 838
- Hansen et al. (2020) Hansen S. H., Hassani F., Lombriser L., Kunz M., 2020, J. Cosmology Astropart. Phys., 2020, 048
- Hayashi & White (2006) Hayashi E., White S. D. M., 2006, MNRAS, 370, L38
- Hwang & Lee (2009) Hwang H. S., Lee M. G., 2009, MNRAS, 397, 2111
- HyeongHan et al. (2020) HyeongHan K., et al., 2020, ApJ, 900, 127
- Ichinohe et al. (2015) Ichinohe Y., Werner N., Simionescu A., Allen S. W., Canning R. E. A., Ehlert S., Mernier F., Takahashi T., 2015, MNRAS, 448, 2971
- Jee et al. (2014) Jee M. J., Hughes J. P., Menanteau F., Sifón C., Mandelbaum R., Barrientos L. F., Infante L., Ng K. Y., 2014, ApJ, 785, 20
- Jee et al. (2015) Jee M. J., et al., 2015, ApJ, 802, 46
- Jee et al. (2016) Jee M. J., Dawson W. A., Stroe A., Wittman D., van Weeren R. J., Brüggen M., Bradač M., Röttgering H., 2016, ApJ, 817, 179
- Jing et al. (1995) Jing Y. P., Mo H. J., Borner G., Fang L. Z., 1995, MNRAS, 276, 417
- Kato et al. (2015) Kato Y., Nakazawa K., Gu L., Akahori T., Takizawa M., Fujita Y., Makishima K., 2015, PASJ, 67, 71
- Kempner & David (2004) Kempner J. C., David L. P., 2004, MNRAS, 349, 385
- Kim et al. (2019) Kim M., Jee M. J., Finner K., Golovich N., Wittman D. M., van Weeren R. J., Dawson W. A., 2019, ApJ, 874, 143
- Kim et al. (2021) Kim J., et al., 2021, ApJ, 923, 101
- Knowles et al. (2016) Knowles K., et al., 2016, MNRAS, 459, 4240
- Knowles et al. (2022) Knowles K., et al., 2022, A&A, 657, A56
- Koester et al. (2007) Koester B. P., et al., 2007, ApJ, 660, 239
- Kraljic & Sarkar (2015) Kraljic D., Sarkar S., 2015, J. Cosmology Astropart. Phys., 2015, 050
- Kravtsov & Borgani (2012) Kravtsov A. V., Borgani S., 2012, ARA&A, 50, 353
- Lauer et al. (2014) Lauer T. R., Postman M., Strauss M. A., Graves G. J., Chisari N. E., 2014, ApJ, 797, 82
- Locatelli et al. (2020) Locatelli N. T., et al., 2020, MNRAS, 496, L48
- Lopes et al. (2018) Lopes P. A. A., Trevisan M., Laganá T. F., Durret F., Ribeiro A. L. B., Rembold S. B., 2018, MNRAS, 478, 5473
- Macario et al. (2011) Macario G., Markevitch M., Giacintucci S., Brunetti G., Venturi T., Murray S. S., 2011, ApJ, 728, 82
- Mann & Ebeling (2012) Mann A. W., Ebeling H., 2012, MNRAS, 420, 2120
- Markevitch & Vikhlinin (2007) Markevitch M., Vikhlinin A., 2007, Phys. Rep., 443, 1
- Markevitch et al. (2002) Markevitch M., Gonzalez A. H., David L., Vikhlinin A., Murray S., Forman W., Jones C., Tucker W., 2002, ApJ, 567, L27
- Markevitch et al. (2004) Markevitch M., Gonzalez A. H., Clowe D., Vikhlinin A., Forman W., Jones C., Murray S., Tucker W., 2004, ApJ, 606, 819
- Markevitch et al. (2005) Markevitch M., Govoni F., Brunetti G., Jerius D., 2005, ApJ, 627, 733
- Maurogordato et al. (2008) Maurogordato S., et al., 2008, A&A, 481, 593
- Menanteau et al. (2012) Menanteau F., et al., 2012, ApJ, 748, 7
- Mirakhor et al. (2022) Mirakhor M. S., Walker S. A., Runge J., 2022, MNRAS, 509, 1109
- Mohr et al. (1995) Mohr J. J., Evrard A. E., Fabricant D. G., Geller M. J., 1995, ApJ, 447, 8
- Mohr et al. (1996) Mohr J. J., Geller M. J., Wegner G., 1996, AJ, 112, 1816
- Molino et al. (2019) Molino A., et al., 2019, A&A, 622, A178
- Monteiro-Oliveira et al. (2017) Monteiro-Oliveira R., Cypriano E. S., Machado R. E. G., Lima Neto G. B., Ribeiro A. L. B., Sodré L., Dupke R., 2017, MNRAS, 466, 2614
- Monteiro-Oliveira et al. (2018) Monteiro-Oliveira R., Cypriano E. S., Vitorelli A. Z., Ribeiro A. L. B., Sodré L., Dupke R., Mendes de Oliveira C., 2018, MNRAS, 481, 1097
- O’Hara et al. (2004) O’Hara T. B., Mohr J. J., Guerrero M. A., 2004, ApJ, 604, 604
- Oak & Paul (2024) Oak T., Paul S., 2024, MNRAS,
- Oguri (2014) Oguri M., 2014, MNRAS, 444, 147
- Okabe et al. (2011) Okabe N., Bourdin H., Mazzotta P., Maurogordato S., 2011, ApJ, 741, 116
- Owers et al. (2013) Owers M. S., et al., 2013, ApJ, 772, 104
- Paterno-Mahler et al. (2014) Paterno-Mahler R., Randall S. W., Bulbul E., Andrade-Santos F., Blanton E. L., Jones C., Murray S., Johnson R. E., 2014, ApJ, 791, 104
- Pearson et al. (2014) Pearson D. W., Batiste M., Batuski D. J., 2014, MNRAS, 441, 1601
- Piffaretti et al. (2011) Piffaretti R., Arnaud M., Pratt G. W., Pointecouteau E., Melin J.-B., 2011, A&A, 534, A109
- Piraino-Cerda et al. (2024) Piraino-Cerda F., et al., 2024, MNRAS, 528, 919
- Planck Collaboration et al. (2013) Planck Collaboration et al., 2013, A&A, 550, A134
- Porter et al. (2008) Porter S. C., Raychaudhury S., Pimbblet K. A., Drinkwater M. J., 2008, MNRAS, 388, 1152
- Rahaman et al. (2021) Rahaman M., Raja R., Datta A., Burns J. O., Alden B., Rapetti D., 2021, MNRAS, 505, 480
- Regos & Geller (1989) Regos E., Geller M. J., 1989, AJ, 98, 755
- Rines & Diaferio (2006) Rines K., Diaferio A., 2006, AJ, 132, 1275
- Russell et al. (2010) Russell H. R., Sanders J. S., Fabian A. C., Baum S. A., Donahue M., Edge A. C., McNamara B. R., O’Dea C. P., 2010, MNRAS, 406, 1721
- Russell et al. (2012) Russell H. R., et al., 2012, MNRAS, 423, 236
- Rykoff et al. (2014) Rykoff E. S., et al., 2014, ApJ, 785, 104
- Rykoff et al. (2016) Rykoff E. S., et al., 2016, ApJS, 224, 1
- Sakelliou & Ponman (2004) Sakelliou I., Ponman T. J., 2004, MNRAS, 351, 1439
- Sakelliou & Ponman (2006) Sakelliou I., Ponman T. J., 2006, MNRAS, 367, 1409
- Santos et al. (2008) Santos J. S., Rosati P., Tozzi P., Böhringer H., Ettori S., Bignamini A., 2008, A&A, 483, 35
- Schuecker et al. (2001) Schuecker P., Böhringer H., Reiprich T. H., Feretti L., 2001, A&A, 378, 408
- Smargon et al. (2012) Smargon A., Mandelbaum R., Bahcall N., Niederste-Ostholt M., 2012, MNRAS, 423, 856
- Smith et al. (2005) Smith G. P., Kneib J.-P., Smail I., Mazzotta P., Ebeling H., Czoske O., 2005, MNRAS, 359, 417
- Sommer et al. (2017) Sommer M. W., Basu K., Intema H., Pacaud F., Bonafede A., Babul A., Bertoldi F., 2017, MNRAS, 466, 996
- Springel et al. (2005) Springel V., et al., 2005, Nature, 435, 629
- Stancioli et al. (2023) Stancioli R., Wittman D., Finner K., Bouhrik F., 2023, arXiv e-prints, p. arXiv:2307.10174
- Strüder et al. (2001) Strüder L., et al., 2001, A&A, 365, L18
- Tanaka et al. (2021) Tanaka K., Fujimoto R., Okabe N., Mitsuishi I., Akamatsu H., Ota N., Oguri M., Nishizawa A. J., 2021, PASJ, 73, 584
- Tejos et al. (2016) Tejos N., et al., 2016, MNRAS, 455, 2662
- Tempel et al. (2017) Tempel E., Tuvikene T., Kipper R., Libeskind N. I., 2017, A&A, 602, A100
- Ulmer & Cruddace (1982) Ulmer M. P., Cruddace R. G., 1982, ApJ, 258, 434
- Vikhlinin et al. (2005) Vikhlinin A., Markevitch M., Murray S. S., Jones C., Forman W., Van Speybroeck L., 2005, ApJ, 628, 655
- Weisskopf et al. (2000) Weisskopf M. C., Tananbaum H. D., Van Speybroeck L. P., O’Dell S. L., 2000, in Truemper J. E., Aschenbach B., eds, Society of Photo-Optical Instrumentation Engineers (SPIE) Conference Series Vol. 4012, X-Ray Optics, Instruments, and Missions III. pp 2–16 (arXiv:astro-ph/0004127), doi:10.1117/12.391545
- Wen & Han (2013) Wen Z. L., Han J. L., 2013, MNRAS, 436, 275
- Wen & Han (2015a) Wen Z. L., Han J. L., 2015a, MNRAS, 448, 2
- Wen & Han (2015b) Wen Z. L., Han J. L., 2015b, ApJ, 807, 178
- Wen & Han (2021) Wen Z. L., Han J. L., 2021, MNRAS, 500, 1003
- Wen & Han (2022) Wen Z. L., Han J. L., 2022, MNRAS,
- Wen & Han (2024) Wen Z. L., Han J. L., 2024, arXiv e-prints, p. arXiv:2404.02002
- Wen et al. (2009) Wen Z. L., Han J. L., Liu F. S., 2009, ApJS, 183, 197
- Wen et al. (2012) Wen Z. L., Han J. L., Liu F. S., 2012, ApJS, 199, 34
- Werner et al. (2008) Werner N., Finoguenov A., Kaastra J. S., Simionescu A., Dietrich J. P., Vink J., Böhringer H., 2008, A&A, 482, L29
- West et al. (1988) West M. J., Oemler Jr. A., Dekel A., 1988, ApJ, 327, 1
- Wittman et al. (2023) Wittman D., Stancioli R., Finner K., Bouhrik F., van Weeren R., Botteon A., 2023, arXiv e-prints, p. arXiv:2306.01715
- Yang et al. (2021) Yang X., et al., 2021, ApJ, 909, 143
- Yu et al. (2018) Yu H., Diaferio A., Serra A. L., Baldi M., 2018, ApJ, 860, 118
- Yuan & Han (2020) Yuan Z. S., Han J. L., 2020, MNRAS, 497, 5485
- Yuan et al. (2022) Yuan Z. S., Han J. L., Wen Z. L., 2022, MNRAS, 513, 3013
- Yuan et al. (2023) Yuan Z. S., Han J. L., Böhringer H., Wen Z. L., Chon G., 2023, MNRAS, 523, 1364
- Zhang et al. (2013) Zhang Y., Dietrich J. P., McKay T. A., Sheldon E. S., Nguyen A. T. Q., 2013, ApJ, 773, 115
- Zhang et al. (2021) Zhang X., et al., 2021, A&A, 656, A59
- Zou et al. (2022) Zou H., et al., 2022, Research in Astronomy and Astrophysics, 22, 065001
- van Weeren et al. (2010) van Weeren R. J., Röttgering H. J. A., Brüggen M., Hoeft M., 2010, Science, 330, 347
- van Weeren et al. (2012) van Weeren R. J., Röttgering H. J. A., Intema H. T., Rudnick L., Brüggen M., Hoeft M., Oonk J. B. R., 2012, A&A, 546, A124
- van Weeren et al. (2019) van Weeren R. J., de Gasperin F., Akamatsu H., Brüggen M., Feretti L., Kang H., Stroe A., Zandanel F., 2019, Space Sci. Rev., 215, 16
Appendix A The best scale for smoothed optical images


We have to find a proper smoothing scale to construct a smoothed optical map for the stellar mass distribution of galaxies, from which merging subclusters can be recognized. We test a series of smooth scales from 0.05 to 0.15 which have been proposed for some merging clusters in literature, e.g. for clusters of CIZA J2242.8+5301, RX J0603.3+4214, MACS J1149.5+2223, ZwCl 0008.8+5215 and PLCK G287.0+32.9 (Jee et al., 2015; Jee et al., 2016; Golovich et al., 2016, 2017; Finner et al., 2017). We also compile the merging clusters with subclusters recognized and the masses of subclusters derived by weak lensing and dynamical methods, including A1758, MACS J1149.5+2223, ZwCl 2341.1+0000, Abell 56, A115, A1240, A2034, A1750, A1995, A2440, SPT-CL J2023-5535, ACT-CL J0256.5, RXCJ1230.7+3439, RM J150822.0+575515.2 and HSC J085024+001536 (Mohr et al., 1996; Hwang & Lee, 2009; Barrena et al., 2009, 2022; Boschin et al., 2012b; Knowles et al., 2016; Golovich et al., 2016; Monteiro-Oliveira et al., 2017; Benson et al., 2017; Monteiro-Oliveira et al., 2018; Kim et al., 2019; HyeongHan et al., 2020; Tanaka et al., 2021; Wittman et al., 2023; Stancioli et al., 2023). For each smooth scale, we recognize the two most prominent subclusters and their mass ratios from our smoothed optical maps are then compared with the values in the literature, as shown in Fig. 10. The data scatter of the mass-ratio offset from the equivalent line is shown in Fig. 11, which varies with the smooth scale. The best consistency for the is found when we adopt . At a larger smooth scale, the subclusters in some clusters can not be resolved, and then the scatter increases significantly.
Appendix B Overlaid X-ray images onto merging clusters and the post-collision mergers
We show in Fig. 12 the smoothed optical map for the 153 merging clusters showing subcluster features with the X-ray contours from the Chandra (Yuan & Han, 2020) and the XMM-Newton observations (Yuan et al., 2022), sorted by the coupling factor. Such overlapped images should be helpful for readers for their future works.
We present in Fig. 13 the projected distribution of member galaxies for the 152 clusters of post-collision mergers overlapped with the X-ray contours from the Chandra (Yuan & Han, 2020) and the XMM-Newton (Yuan et al., 2022).